FTSE 100 at two-month high
The price has enjoyed a strong week, with further gains yesterday taking it to a two-month high after it broke higher at the end of last week.The record high is in sight once more, and the uptrend is firmly in place. It would need a reversal back below 8200 to cancel out this view.
FTSE 100 Daily Chart
| Change in | Longs | Shorts | OI |
| Daily | 2% | -9% | -6% |
| Weekly | -56% | 55% | -6% |
S&P 500 lifted by Fed decision
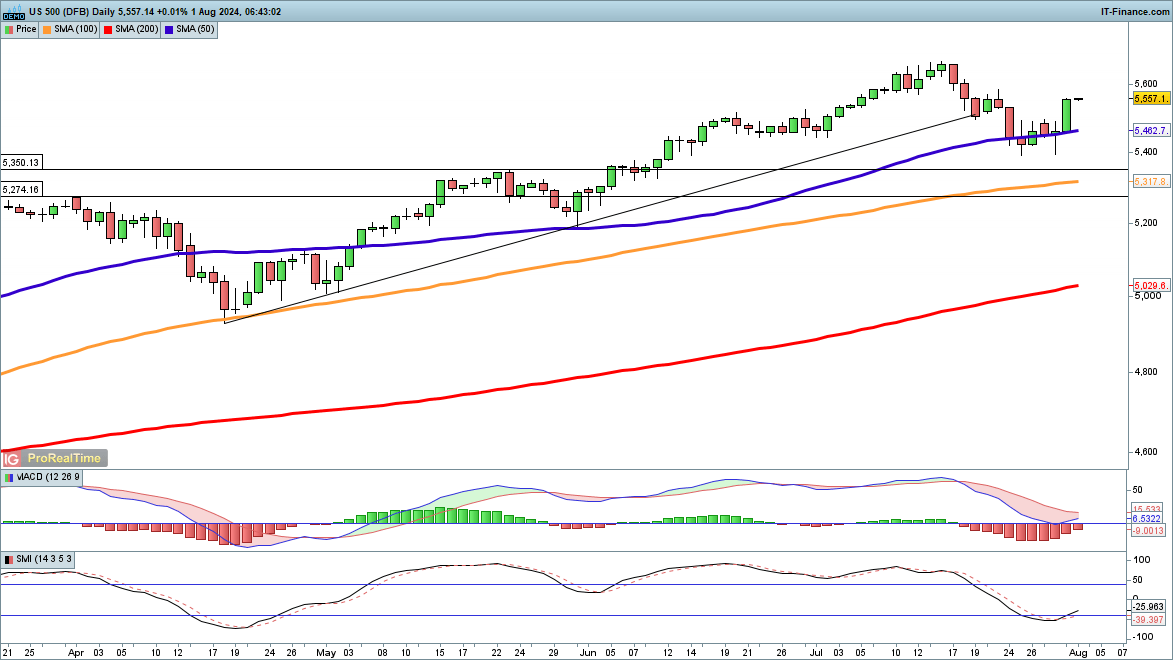
The latest pullback from the mid-July highs appears to have run its course. After stabilising around 5400 this week the index shot higher yesterday, bolstered by the Fed rate decision and the high likelihood of a September rate cut. The record highs of July are the next target.
Sellers will need a reversal back below 5450 to cancel out the bullish view. Amazon and Apple earnings tonight raise the prospect of more volatility.
S&P500 Daily Chart
Nikkei 225 stumbles
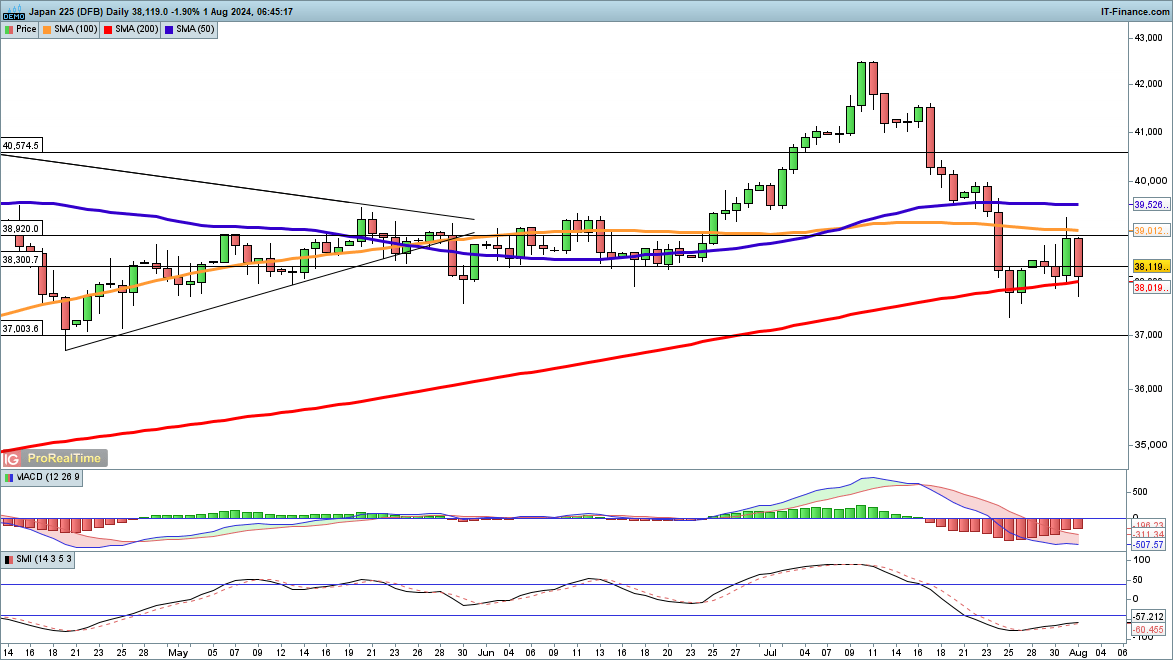
While the index rebounded in the wake of the Bank of Japan meeting, poor earnings from Toyota helped tip the price back to the downside. However, it is worth noting that, for the moment at least, the index is holding above the 200-day simple moving average (SMA). If this continues to hold then a low may yet form.
Alternately, a close below the 200-day would then open the way to a test of last week’s lows, and then down to the April lows below 37,000.
Nikkei 225 Daily Chart
Recommended by Chris Beauchamp
Get Your Free Equities Forecast


