Entry Parameters: Fundamentals and Configuration
By adjusting the Period, Overbought Level, and Oversold Level fields of the RSI, users can fine-tune the trend reversal signals generated by Heikin-Ashi.
Additionally, the Strategy Direction field allows users to optimize parameters for a specific trading direction or apply the same configuration to both.

This feature makes it possible to run multiple instances of SENTINEL Heikin-Ashi on the same account, even operating on the same symbol.
The entry signal is complemented by precise risk exposure adjustments. The expert advisor calculates the position size based on the distance between the initial stop loss and the entry price, following the user-defined values in the VOLUME, RISK, and SPREAD parameter group. If the calculated size exceeds the available leverage, it will be automatically reduced to comply with restrictions. If the broker’s minimum size for the symbol prevents the trade from being executed, the entry will not occur, even with a valid signal.

The Risk Management menu offers three options for defining exposure: as a percentage of equity, balance, or as a fixed amount. When selecting Risk % of equity or Risk % of balance, the system interprets the value in the Risk Value or Fixed Volume field as the desired percentage. Conversely, if Fixed volume is chosen, this value corresponds to what is defined in MetaTrader’s “Volume” field.

The third field in the group, Acceptable spread (pts), defines the maximum spread allowed to execute trades, avoiding entries during high-spread market conditions. The configured value represents the system’s maximum spread threshold for order execution. Users may opt for a higher value in higher timeframes and a tighter value in timeframes where smaller price moves are expected.

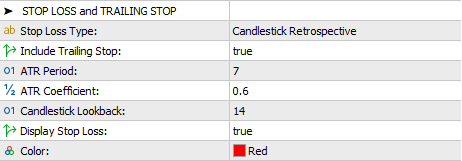
This version of SENTINEL sets Candlestick Retrospective as the default value for the Stop Loss Type field. This option determines the stop loss based on the high or low of a specified number of previous candles, which is defined in the Candlestick Lookback field. Additionally, a volatility-based margin can be added, the size of which is determined by the value in the ATR Coefficient field. The sensitivity of the ATR can be adjusted through the ATR Period field.
The Include Trailing Stop field enables the stop loss criteria to be updated at the start of each new candle (this adjustment only occurs if the change favors the trade). Stop loss level changes are displayed on the price chart if the Display Stop Loss field is set to true.

The Take Profit Type field provides two options: Based on Stop Loss and Fixed Distance.

When selecting the Based on Stop Loss option, the take profit distance is adjusted in direct proportion to the stop loss distance. This ratio is determined as a fraction or multiple of the stop loss distance, as specified in the Coefficient Over Stop Loss field.
With the Fixed Distance option, the take profit level is set at a specific distance in points, defined by the value in the Fixed Distance (pts) field.
Similar to the stop loss, the take profit configuration includes the Include Trailing Take Profit field, which allows the take profit level to be updated at the start of each new candle. This adjustment only occurs if the change favors the trade. Take profit level changes are displayed on the price chart if the Display Take Profit field is set to true.
Practical Example: Trade Analysis
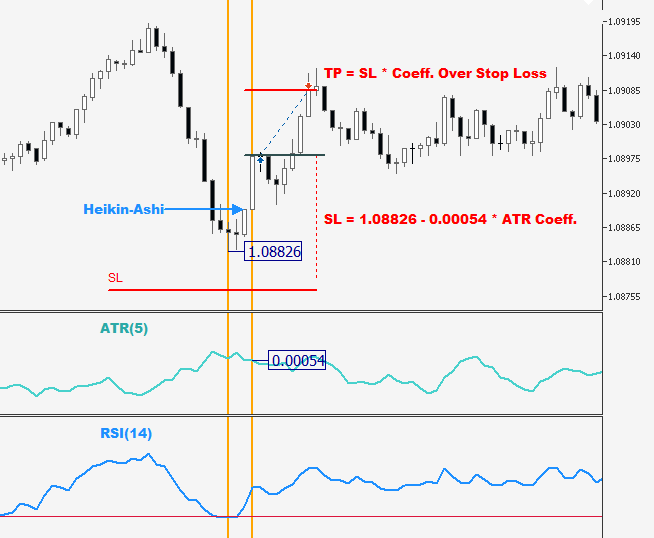
The following image showcases a trade executed by SENTINEL Heikin-Ashi, which we will use as an example to illustrate the application of some of the parameters described above. For this purpose, the chart includes candlesticks with price levels as well as the ATR and RSI indicators. Let’s analyze the setup.

The tip of the blue arrow marks the area where the Heikin-Ashi reversal occurred, coinciding with the RSI exiting the oversold zone. This triggered a long entry, accompanied by its corresponding stop loss (SL) and take profit (TP). Here’s how their respective levels were determined. To simplify the explanation, we assume the Include Trailing Stop and Include Trailing Take Profit fields are set to false.
We can deduce that the Candlestick Lookback field has a minimum value of 3. Since this is a long trade, the system used the low of the last three candles, marked on the chart as 1.08826. However, the SL level is set below this value, indicating that the ATR Coefficient is greater than 0. While the exact coefficient value cannot be determined from the chart, we know the difference is the product of 0.00054 and the coefficient value. The ATR Period was set to 5, yielding the 0.00054 value at the time of the entry signal. This is how SENTINEL calculated the SL level.
Regarding the TP level, it is evident from the chart that the Take Profit Type menu was set to Based on Stop Loss. This means the Coefficient Over Stop Loss field must have a value greater than zero. In this case, as the TP distance is clearly shorter than the SL distance, the coefficient is less than 1. Visually, it appears to be between 0.5 and 0.6.
If you have any questions about this explanation, feel free to leave a comment.
The results obtained from using the software referenced in this guide are not guaranteed. Trading in financial markets involves significant risk and may not be suitable for all investors. The developer of this module is not responsible for any losses or damages resulting from its use. The developer does not guarantee ongoing support or updates. Use the software at your own risk.


