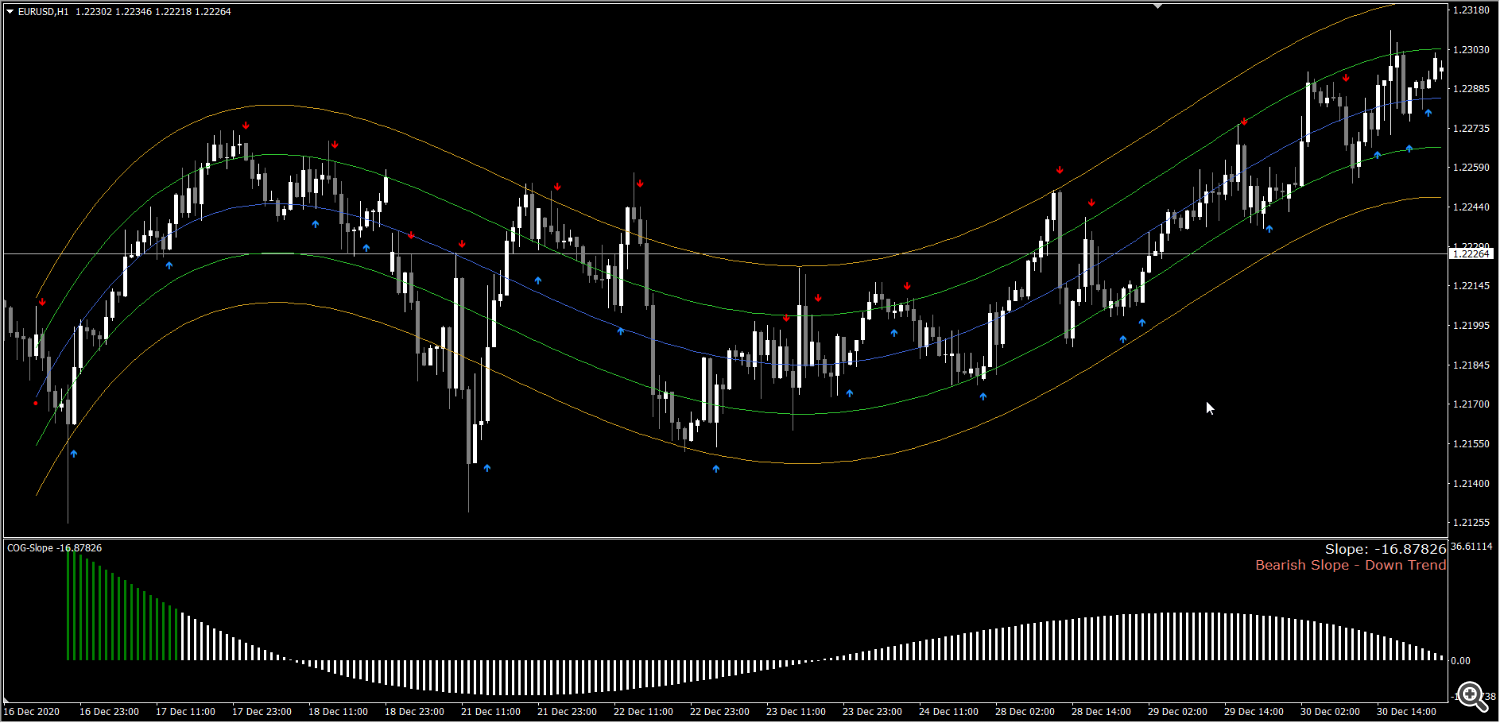
This is a slope indicator for COG (Center of Gravity) indicator.
https://www.mql5.com/en/market/product/59974
Here’s what the slope will look like:
You can set the Slope Threshold for indicating Buy/Sell heightened levels. In the above Image the Threshold is set to 0, because of that all Bullish slope is Green and Bearish is Red.
Suppose we set Threshold to -10 and 10, then this is what we get:
And also set Slope Period. Default is 5, which means it will measure the COG values for past 5 bars and find the Slope based on time for past 5 bars.
You can also get Alerts when slope changes. Alerts can be Popups, Push Notifications, Email or in a File.
Here are all the settings:

Also get COG Slope in Buffer values for specified COG bars back.
What slope means:
If slope is red, it indicates that COG lines are sloping downwards, and price is in downwards trend.
So only trade sell signals.
If slope is Green, it indicates COG lines are sloping upwards and price is in upwards bullish trend.
So only trade buy signals.
Example COG Strategy:
Slope Period: 5. Slope Threshold: 15,-15
COG Bars back 240. And rest are all default values.
Use JB COG Slope if you don’t want it to smooth past bars. And Slope will be based on what the COG actually looked like at that time.
Bullish:
Wait for price to cross Lower most band. And then wait for MA OC Up Arrow.
For strong trades, only trade if slope is Green. For Medium signal: trade if slope is White or Green
Bearish:
Wait for price to cross COG Upper most band. And then wait for MA OC Down Arrow.
For strong signals, only trade if slope is Red. For Medium signal: trade if slope is White or Red


