Advanced Dynamic RSI: Futher development of the RSI
Introduction
The Relative Strength Index (RSI) is one of the best-known indicators in technical analysis. Developed by J. Welles Wilder, Wilder’s goal was to provide traders with a tool to measure the strength of market movements in relation to overbought and oversold conditions. The Advanced Dynamic RSI builds upon Wilder’s work and has been further developed by me to enable even more precise signals and dynamic adjustments to various market conditions.
J. Welles Wilder’s Contribution to Technical Analysis
J. Welles Wilder Jr. was one of the pioneers of technical analysis and, in addition to the RSI, he developed other significant indicators such as the Average True Range (ATR) and the Parabolic SAR. These indicators have revolutionized technical analysis and continue to provide traders with valuable insights into market movements and volatility.
The Evolution of the RSI: Advanced Dynamic RSI
The Advanced Dynamic RSI was developed by me for MetaTrader 5 and extends Wilder’s original RSI concept, as mentioned in the introduction, by incorporating dynamic levels and an adjustable smoothing method. These additional features are intended to provide traders with more flexible and accurate signals. The image below shows a comparison of the AD RSI with the classic RSI. It demonstrates that using dynamic levels can yield better signal generation. As a trading system developer and trader with over 20 years in the markets, I recognized the value of the classic RSI long ago and have now attempted to make something good even better. With version 1 of the AD RSI, I believe I may have taken a step closer to this goal, and I’m pleased to share the results of my work with you here.
Features and Benefits of the Advanced Dynamic RSI
- Dynamic Levels: The indicator calculates overbought and oversold levels dynamically based on a moving average and standard deviation. This enables the indicator to adapt to current market volatility and thus provide more precise signals.
- Adjustable Smoothing: Inspired by Wilder’s original smoothing method, the Advanced Dynamic RSI uses a modified formula that reduces the impact of short-term market fluctuations and delivers more stable signals.
- Visual Customization: The colors and line styles, for example, for the overbought and oversold levels, can be customized to suit individual preferences and optimize visual representation in the chart.
Input Parameters and Their Functions
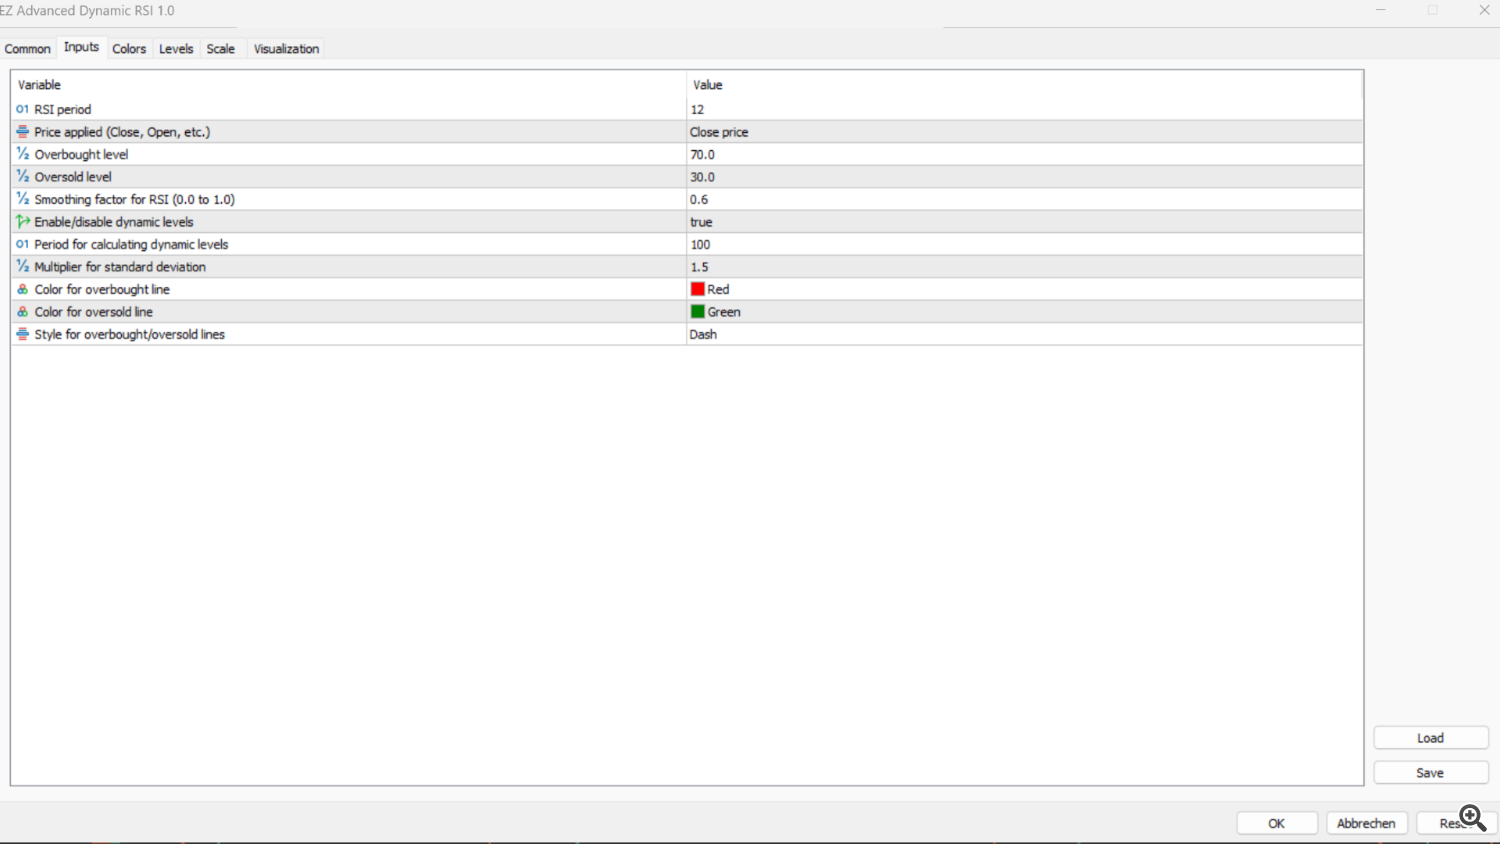
- RSI Period: This input controls the length of the observation period for the RSI calculation. Shorter periods are suitable for short-term traders, while longer periods reflect long-term trends.
- Price Source: The Advanced Dynamic RSI allows the use of various price sources (e.g., closing price, opening price).
- Overbought/Oversold Levels: Fixed values at which the market is considered overbought or oversold. These levels can also be calculated dynamically.
- Smoothing Factor: The smoothing factor enables traders to smooth the RSI progression, providing a more stable visual representation.
- Enable Dynamic Levels: Activates the dynamic calculation of overbought/oversold areas based on market volatility.
Benefits of the Advanced Dynamic RSI
The Advanced Dynamic RSI is designed to be a modern and flexible indicator that addresses the limitations of the classic RSI. It adapts better to various market conditions, with dynamic adjustments and adjustable smoothing aimed at minimizing false signals and supporting better trading decisions. That’s the theory! Now, let’s let the backtest results speak for themselves.
First Backtests: Advanced Dynamic RSI on EURUSD
To evaluate the effectiveness of the Advanced Dynamic RSI, I created a trading strategy and conducted initial backtests on historical data of the EURUSD pair, starting from 2006. The test presented here was run on a 4-hour chart, combined with a simple trend filter and a basic cross logic based on the indicator’s dynamic overbought and oversold lines. For the initial test, a fixed lot size of 0.1 was traded, and a rough optimization of the parameters was performed. The results of these tests provide promising insights and motivate me to continue working on this indicator.
Test Settings and Methodology
The backtest was conducted under the following conditions:
- Time Period: Historical data from 2006
- Time Frame: 4-hour chart (H4)
- Strategy Logic: A simple cross logic where only long positions are opened when the RSI crosses the dynamic oversold line from below. Positions are closed when the RSI crosses the overbought line from above.
- Trend Filter: A simple MA trend filter was used to trade only in the direction of the overarching trend.
Results and Observations
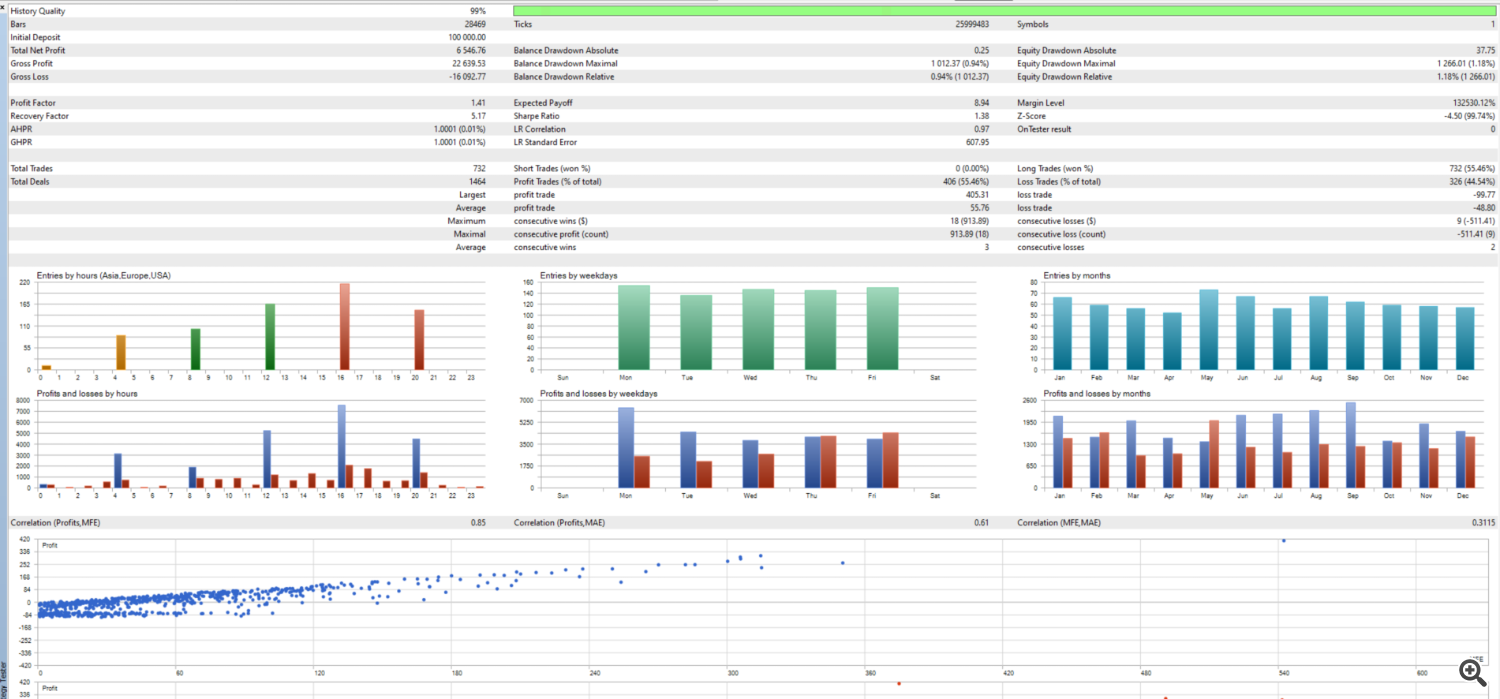
The backtest results indicate positive strategy performance, which appears to be better than the classic RSI. Here are some key metrics from the tests:
- Profit Factor: 1.41
- Total Trades: 732 trades, of which approximately 55.46% were successful.
- Average Profit per Trade: 8.94 USD
In addition to these figures, an analysis of profits and losses by hour, weekday, and month showed that certain periods were more profitable than others. This can be important for future strategy optimizations based on this indicator. Higher profits were seen during European and American trading hours, particularly from midday to the afternoon.
The correlation of profits with maximum favorable and adverse price movement (MFE, MAE) indicates a promising linear correlation, suggesting that the strategy yields consistent results on average.
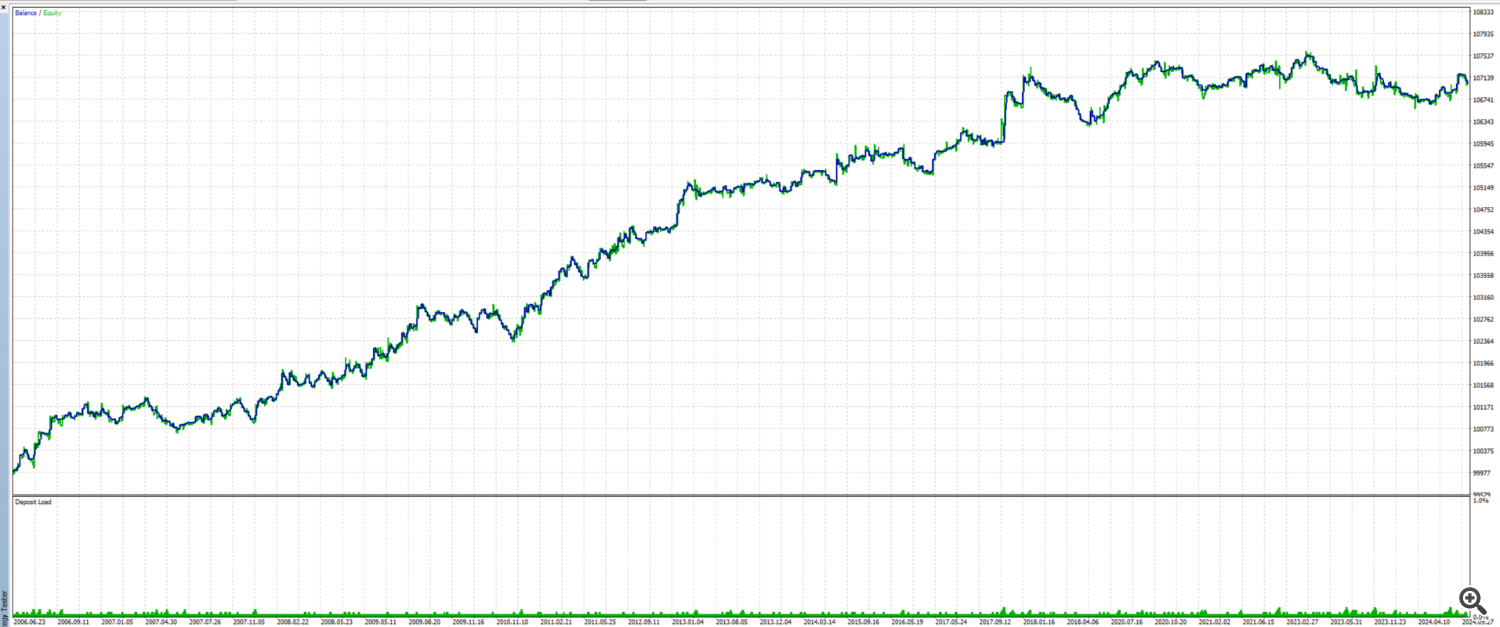
Bild unten: Resultat AD RSI
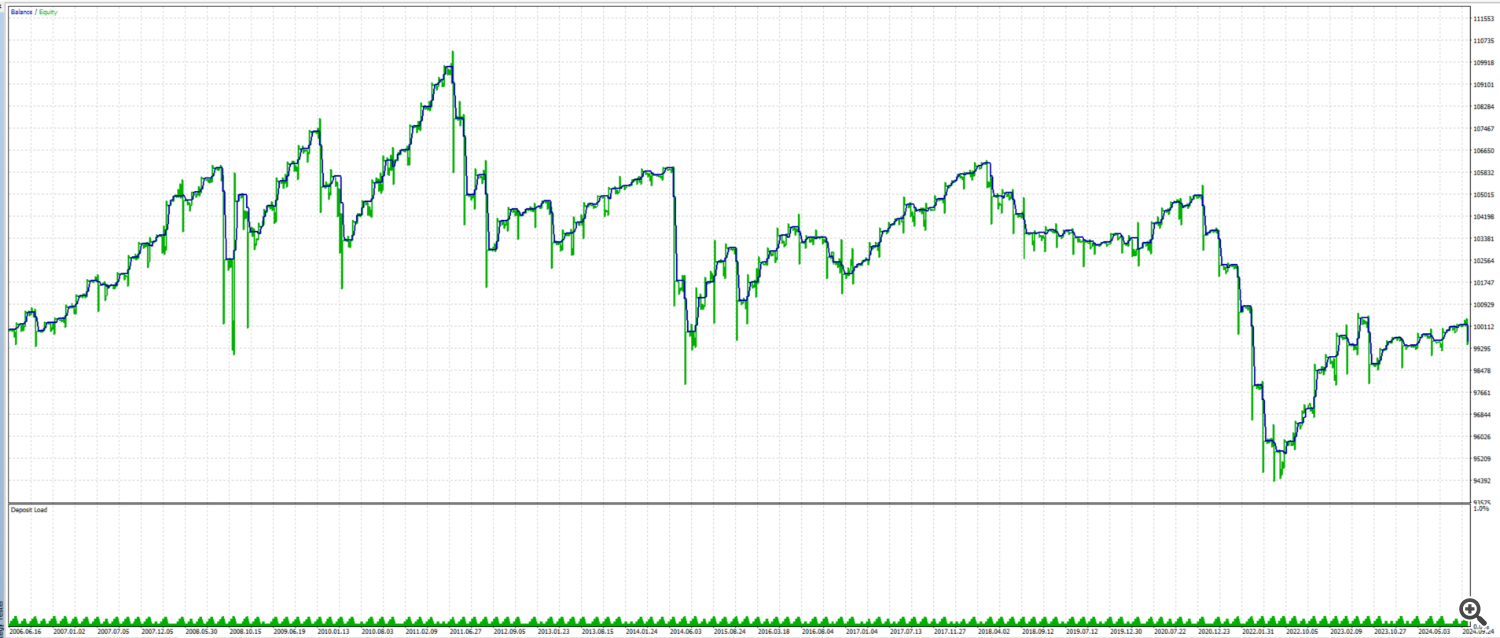
Bild unten: Resultat Klassik RSI
BIld unten: Resultat AD RSI
Conclusion of the First Backtests
The backtest results are promising and confirm the effectiveness of the Advanced Dynamic RSI indicator in EURUSD analysis. The dynamic overbought and oversold levels have shown to provide valuable signals. These initial tests motivate me to further refine the indicator and make additional optimizations to enhance its performance. The indicator is currently available for free on the MetaTrader Marketplace. Feel free to use it for your own tests.


