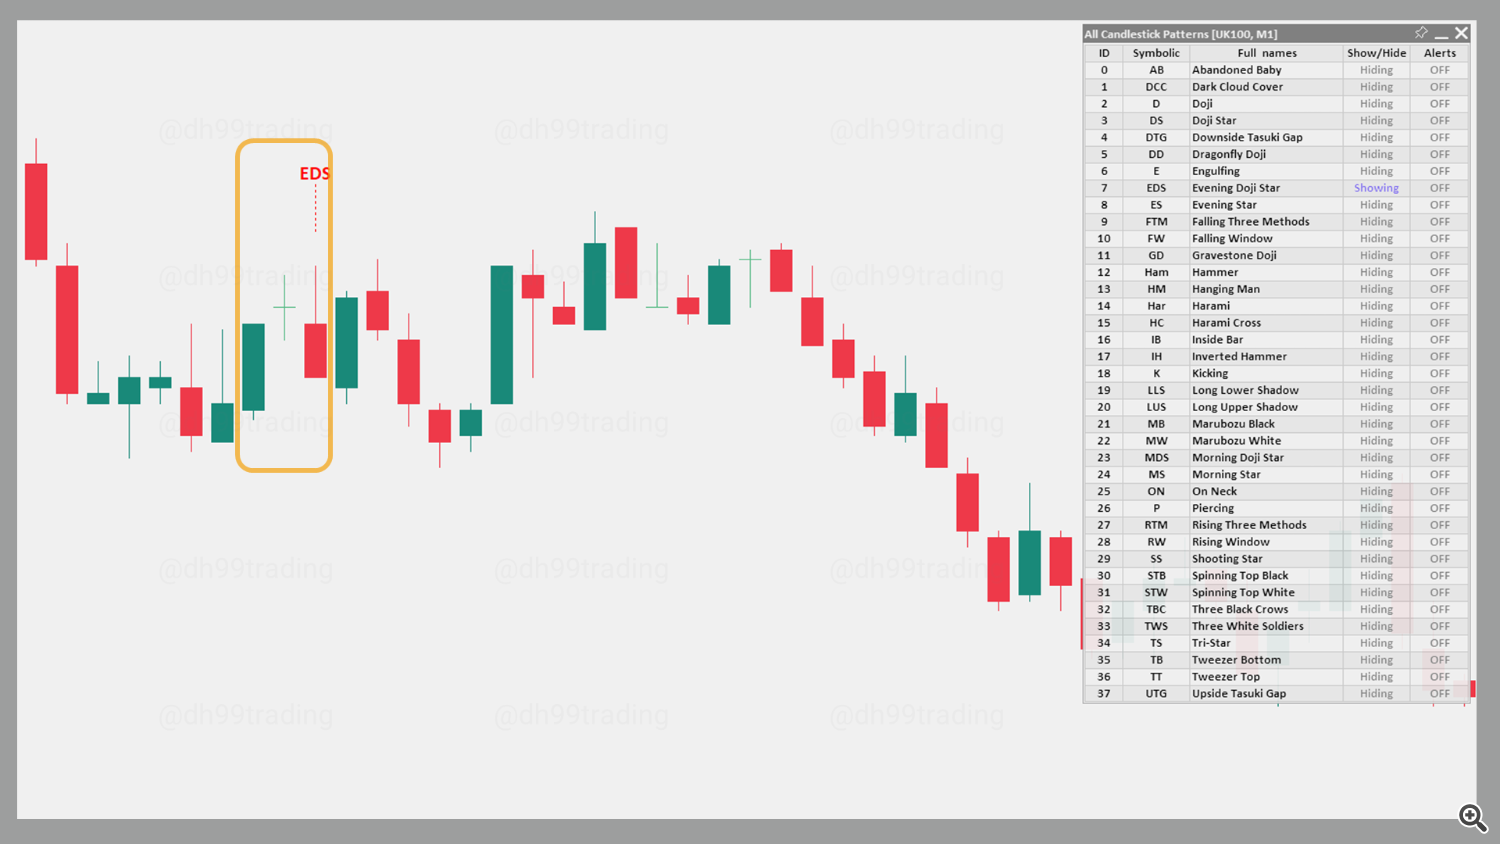
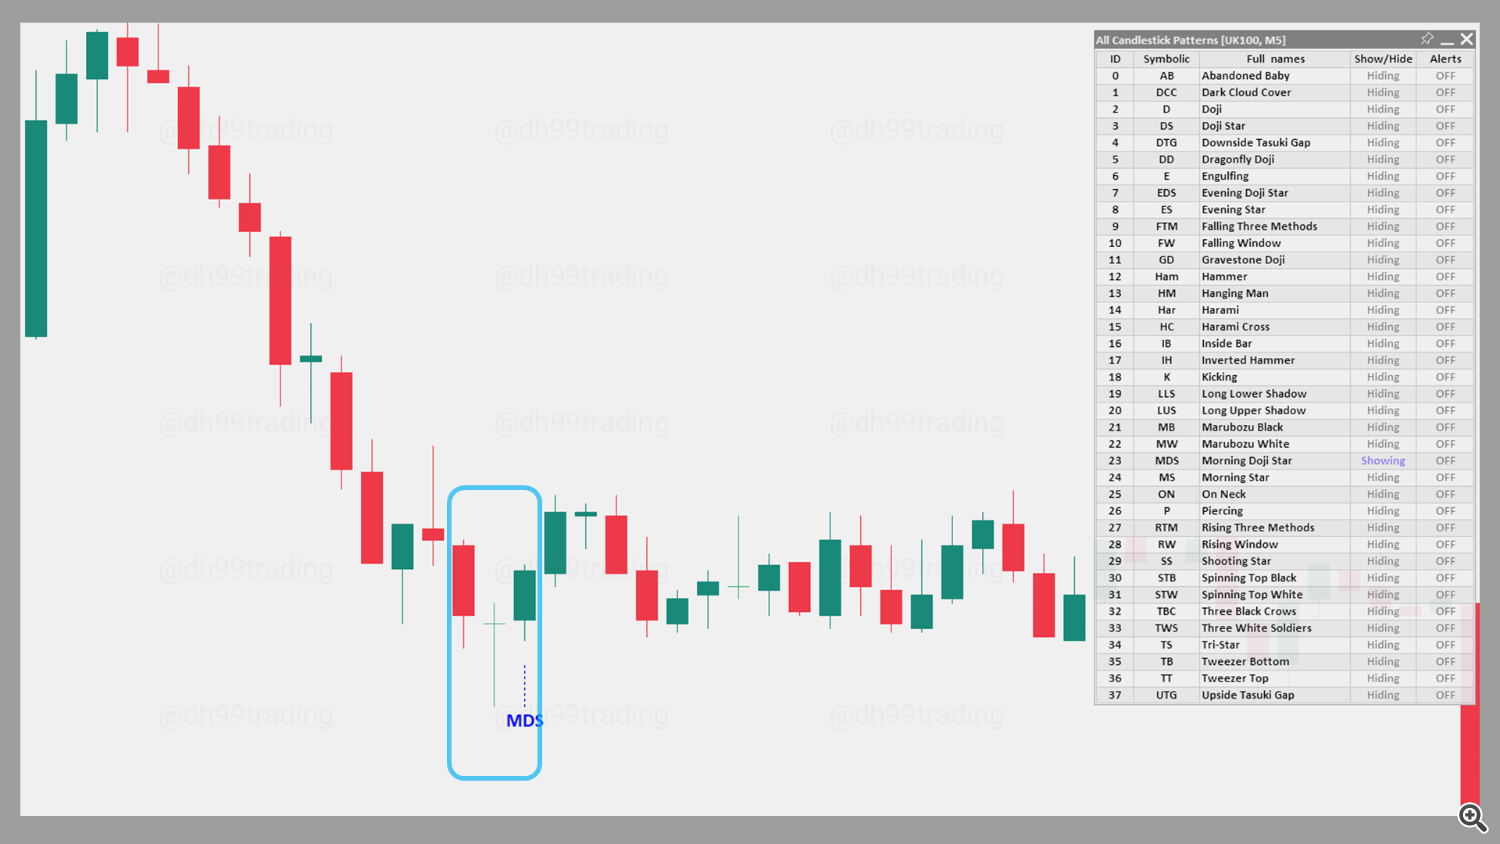
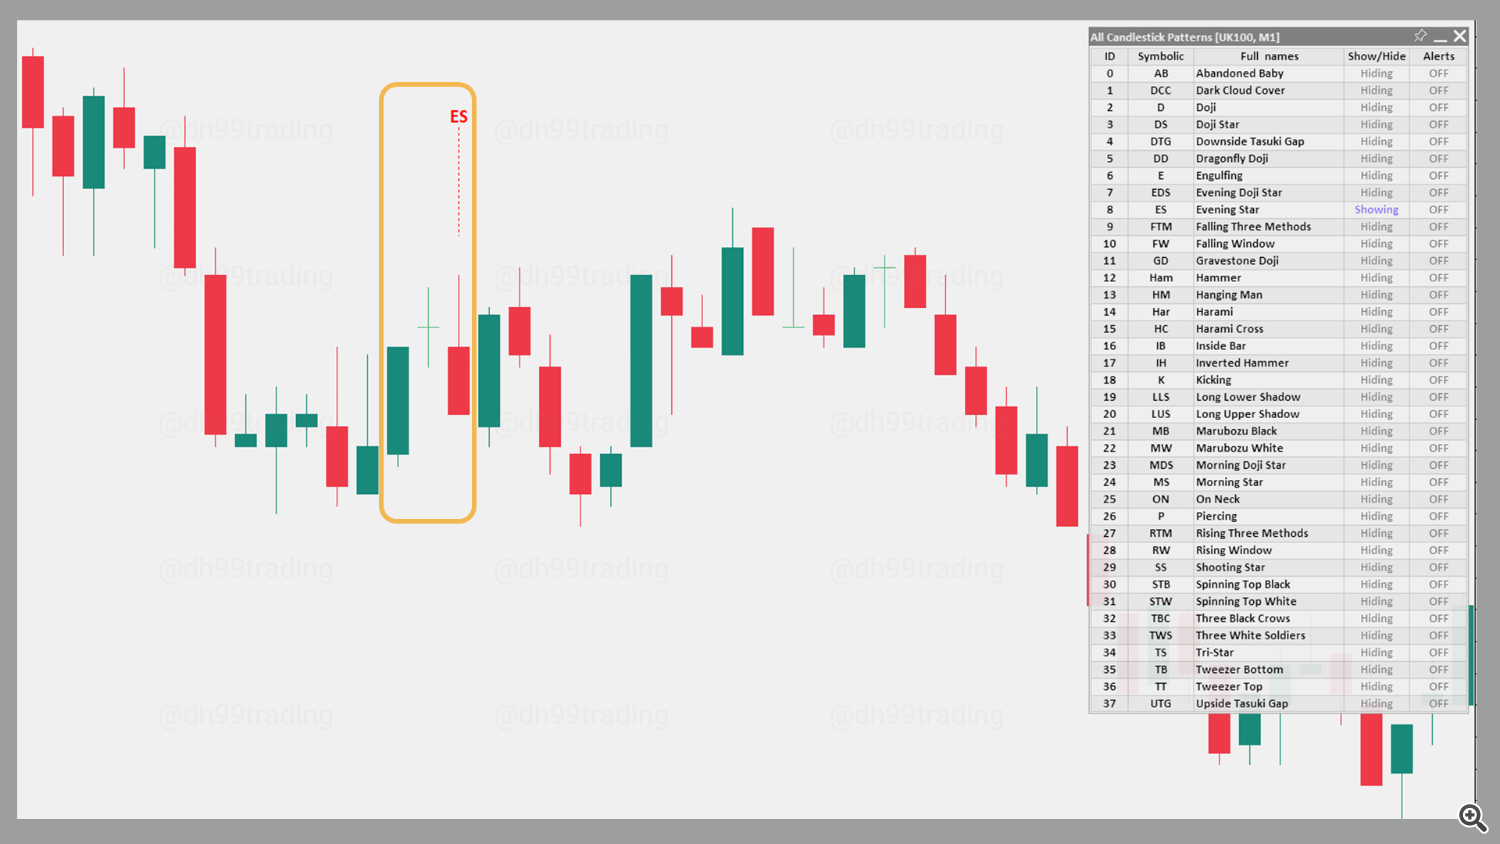
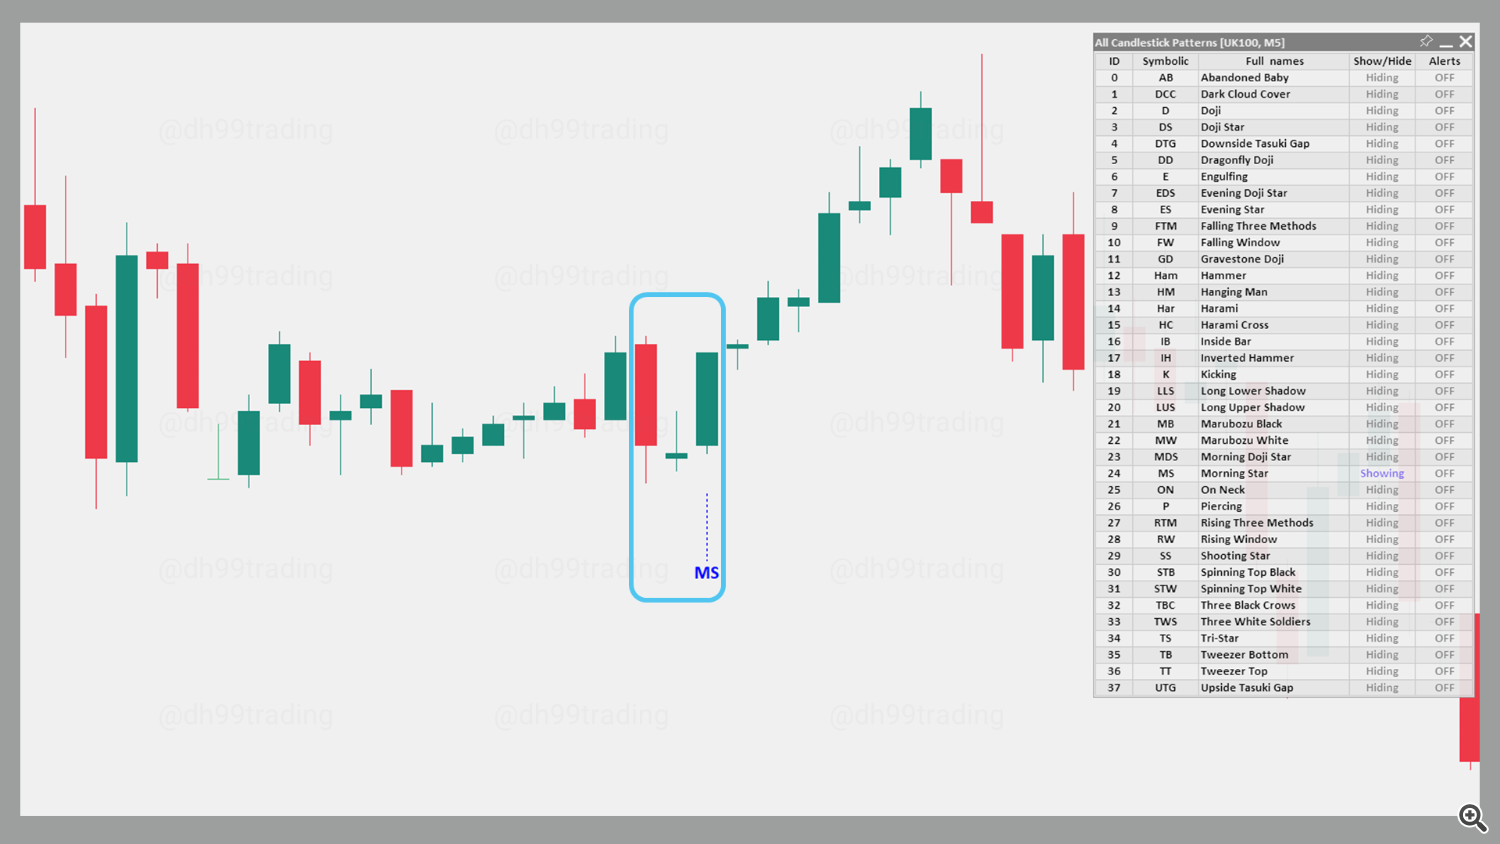
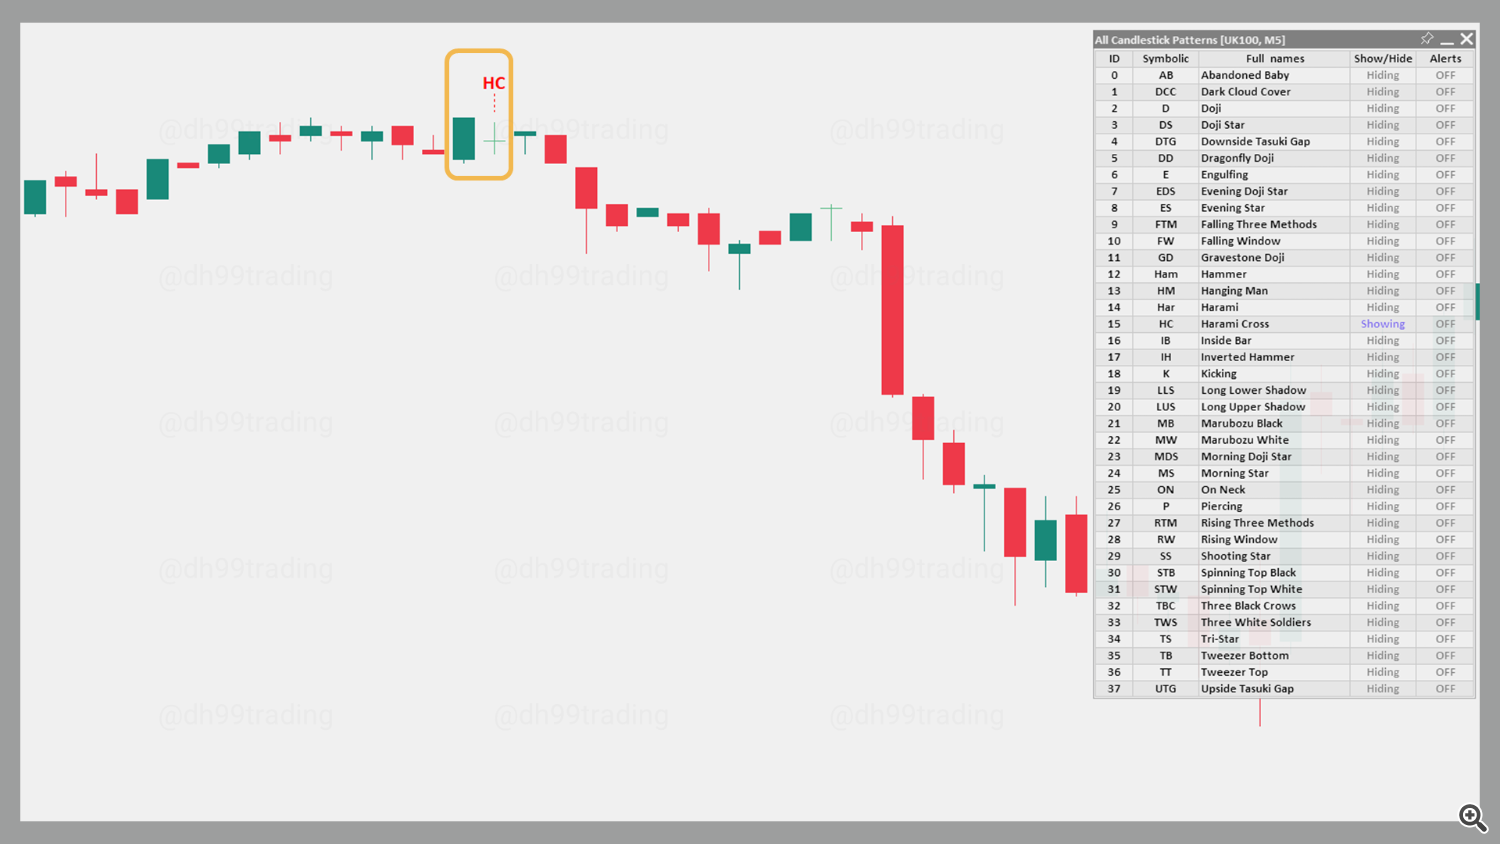
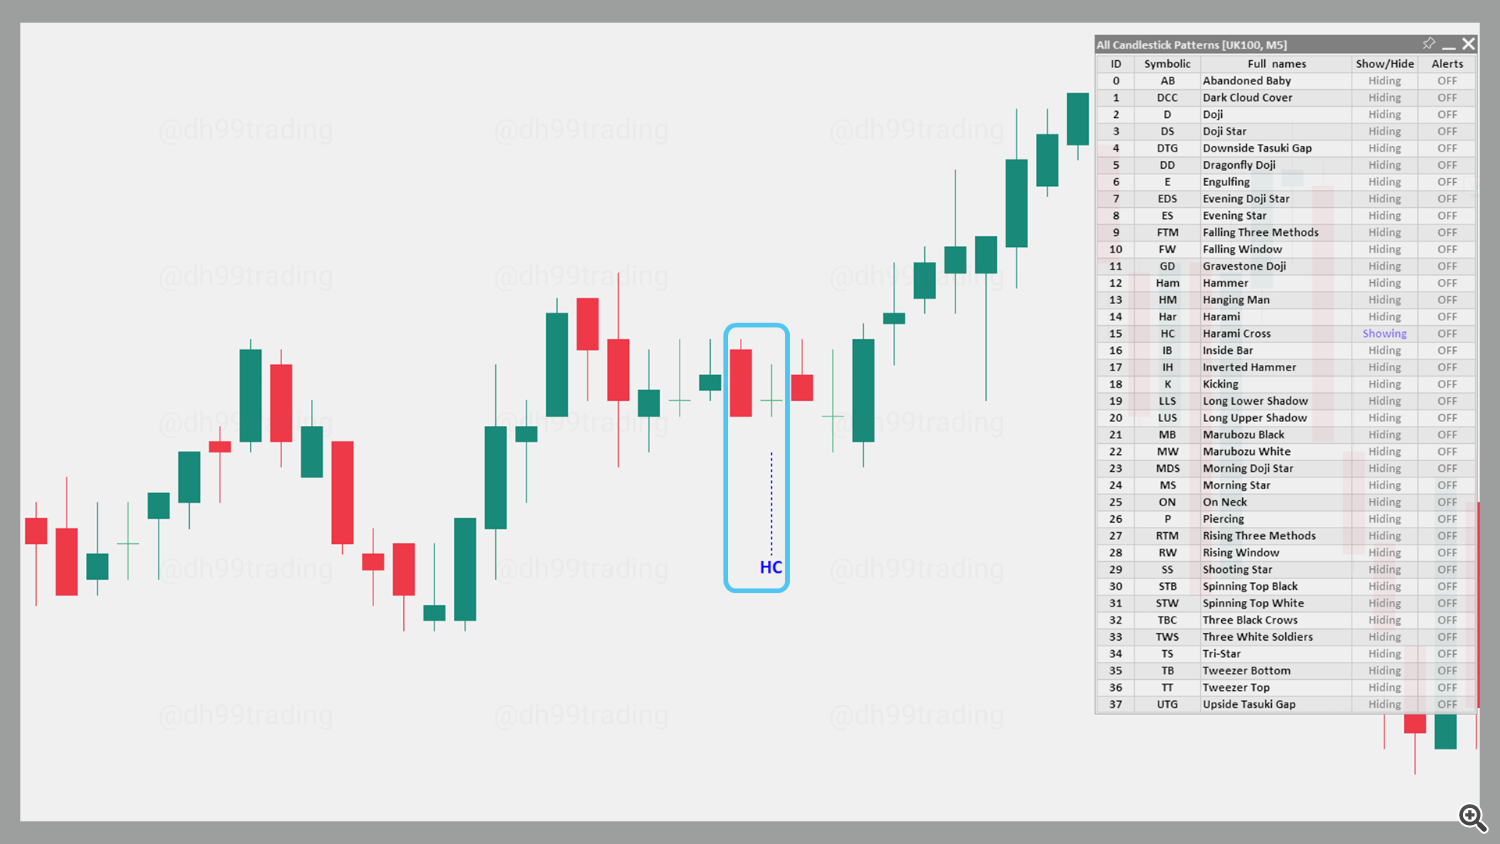
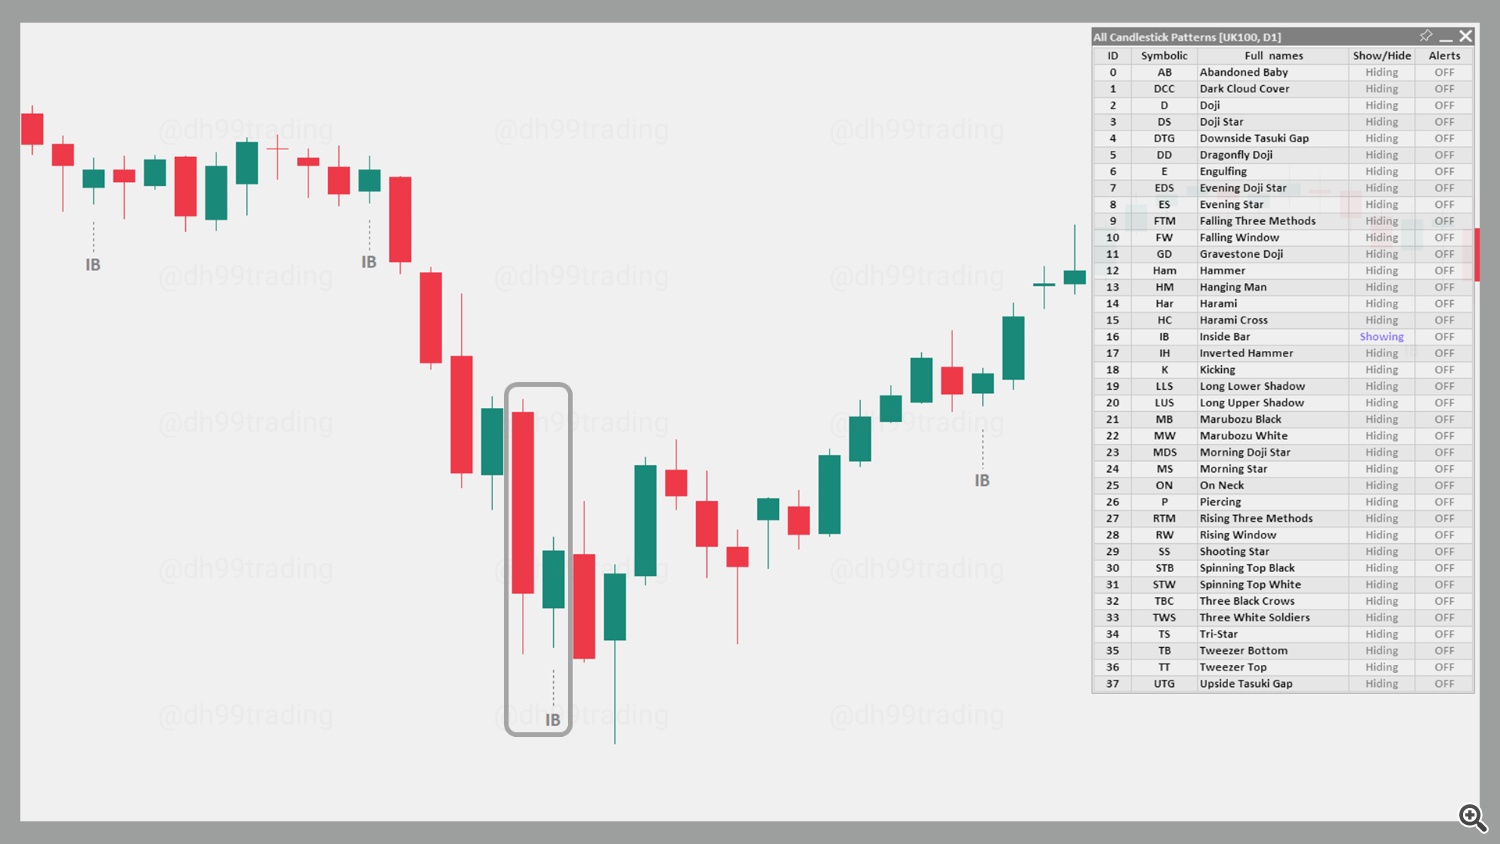
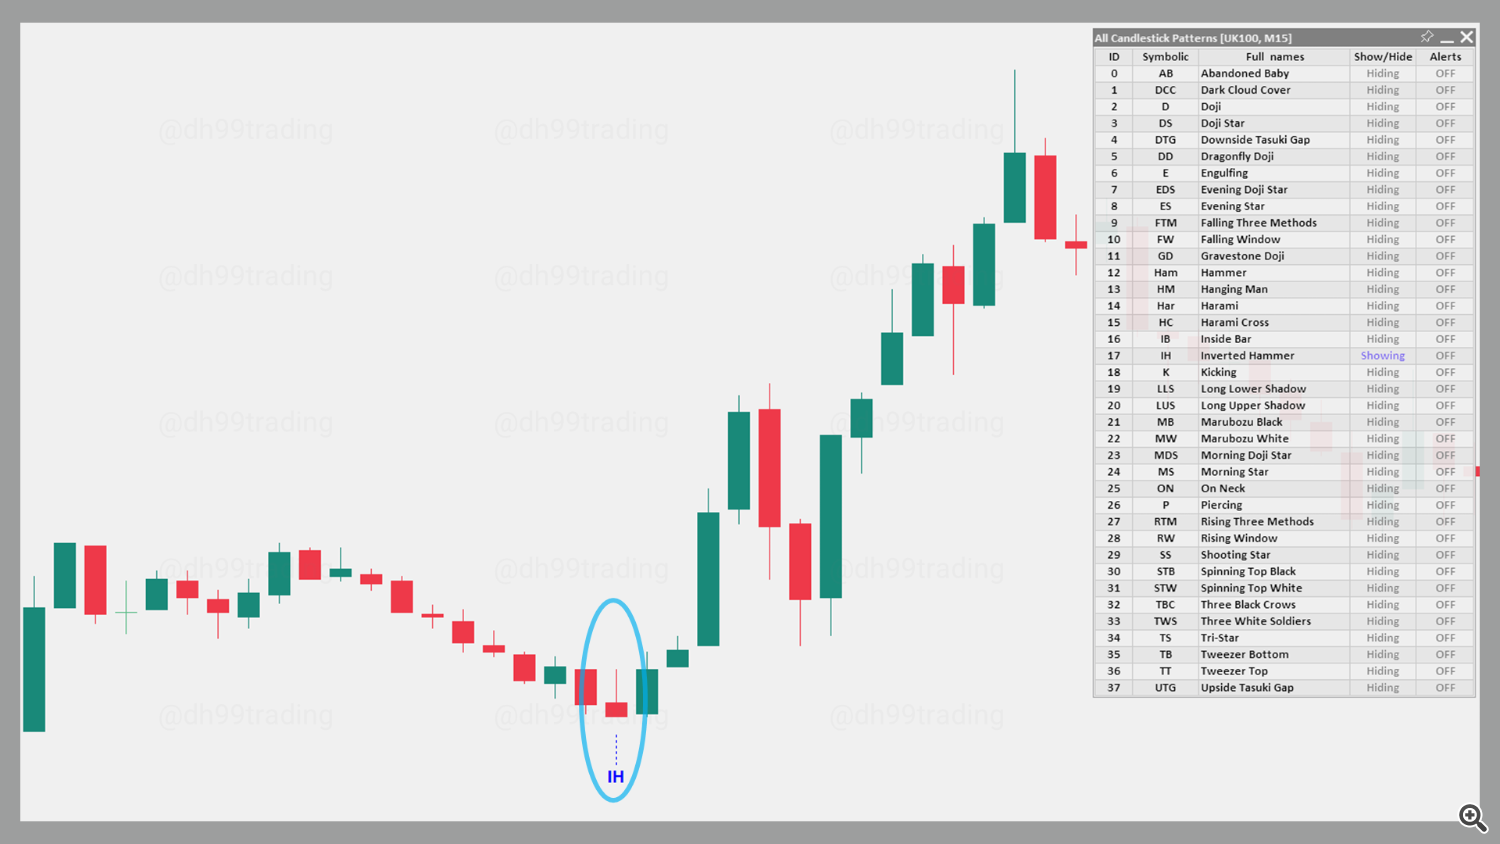
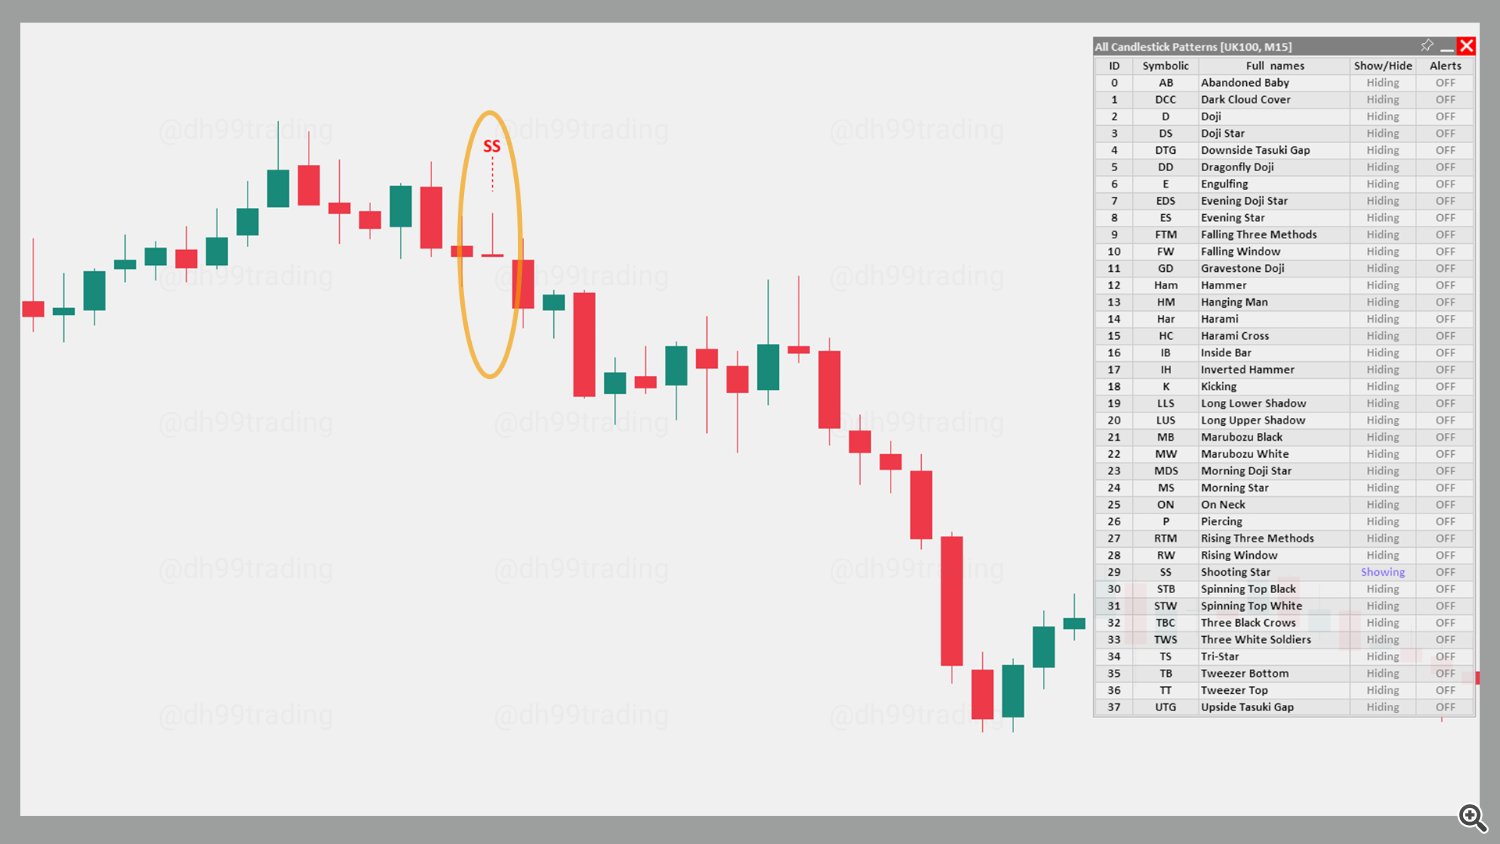
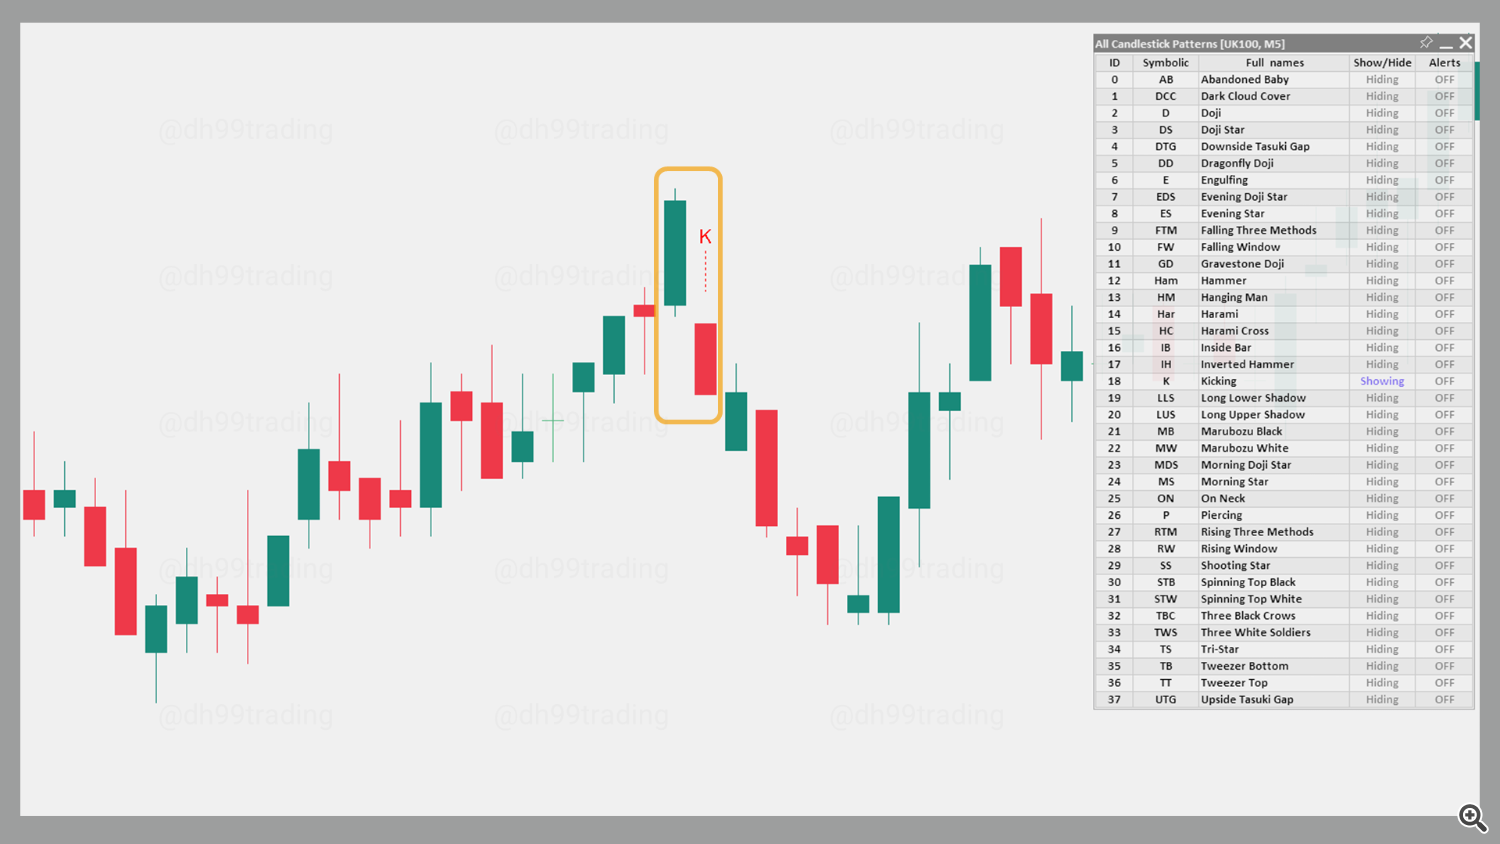
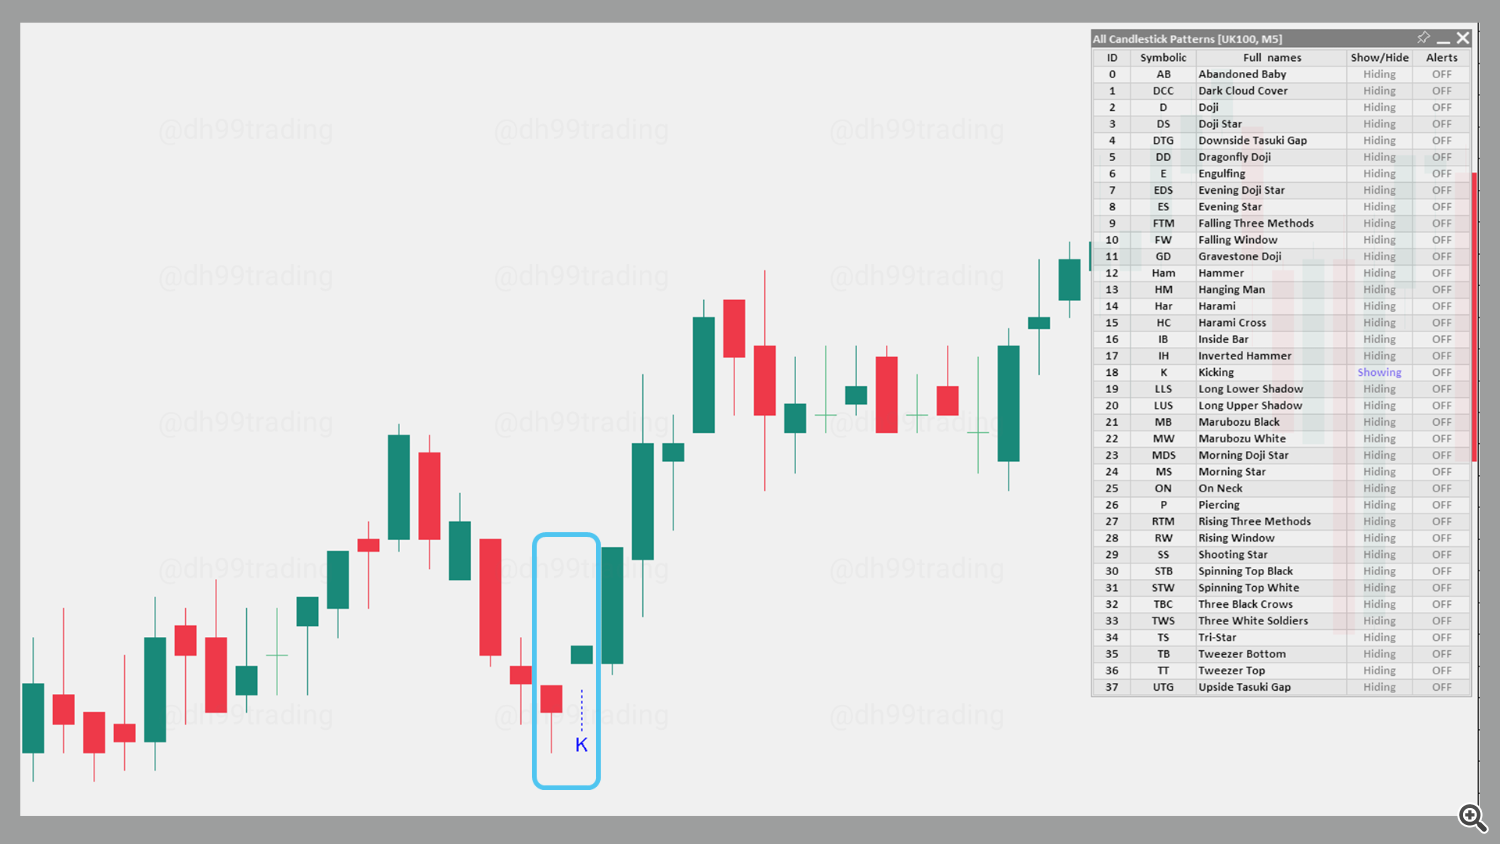
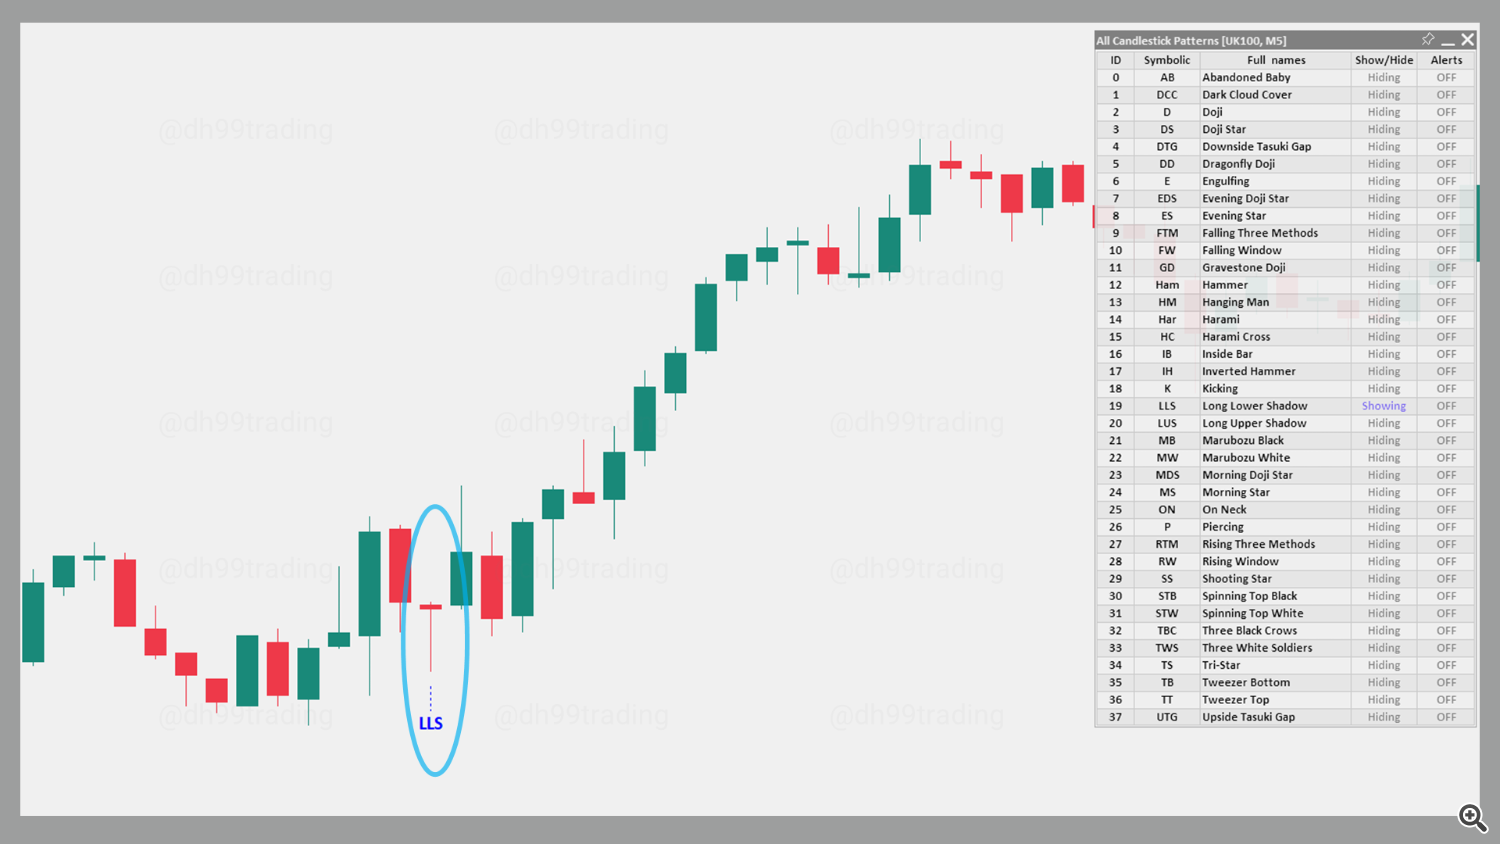
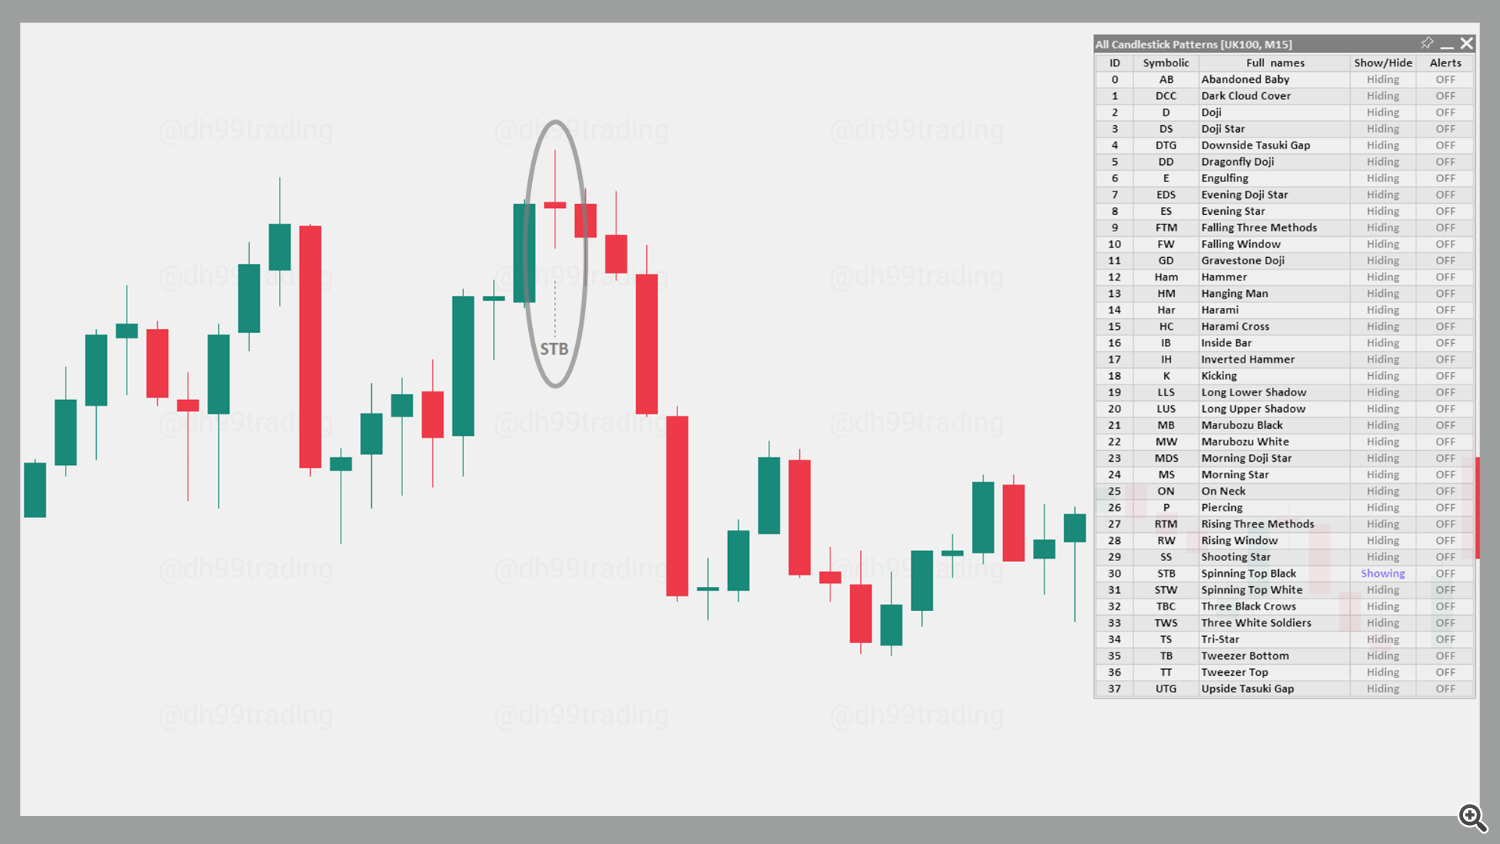
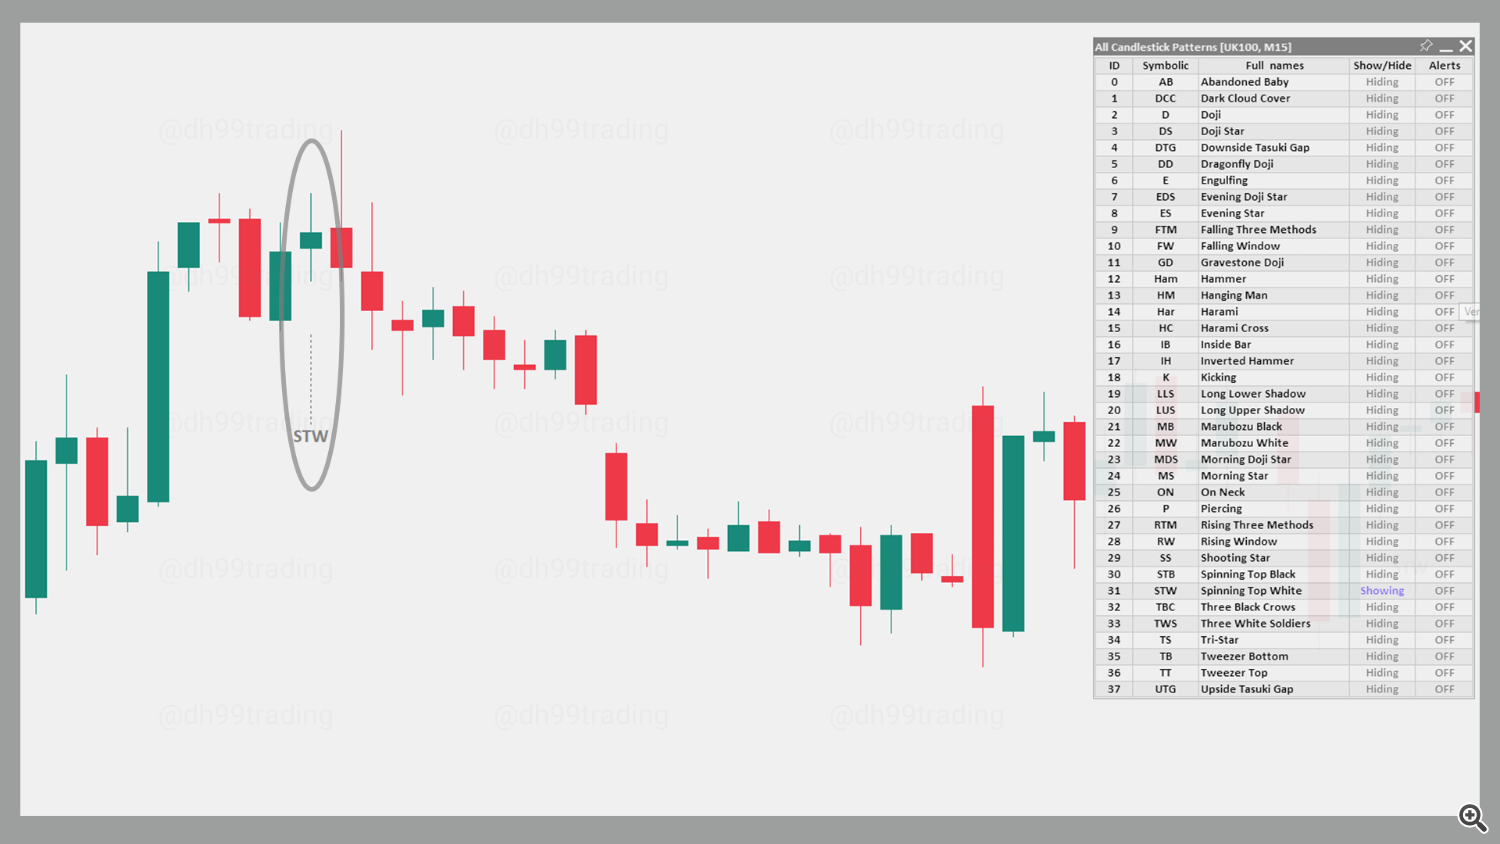
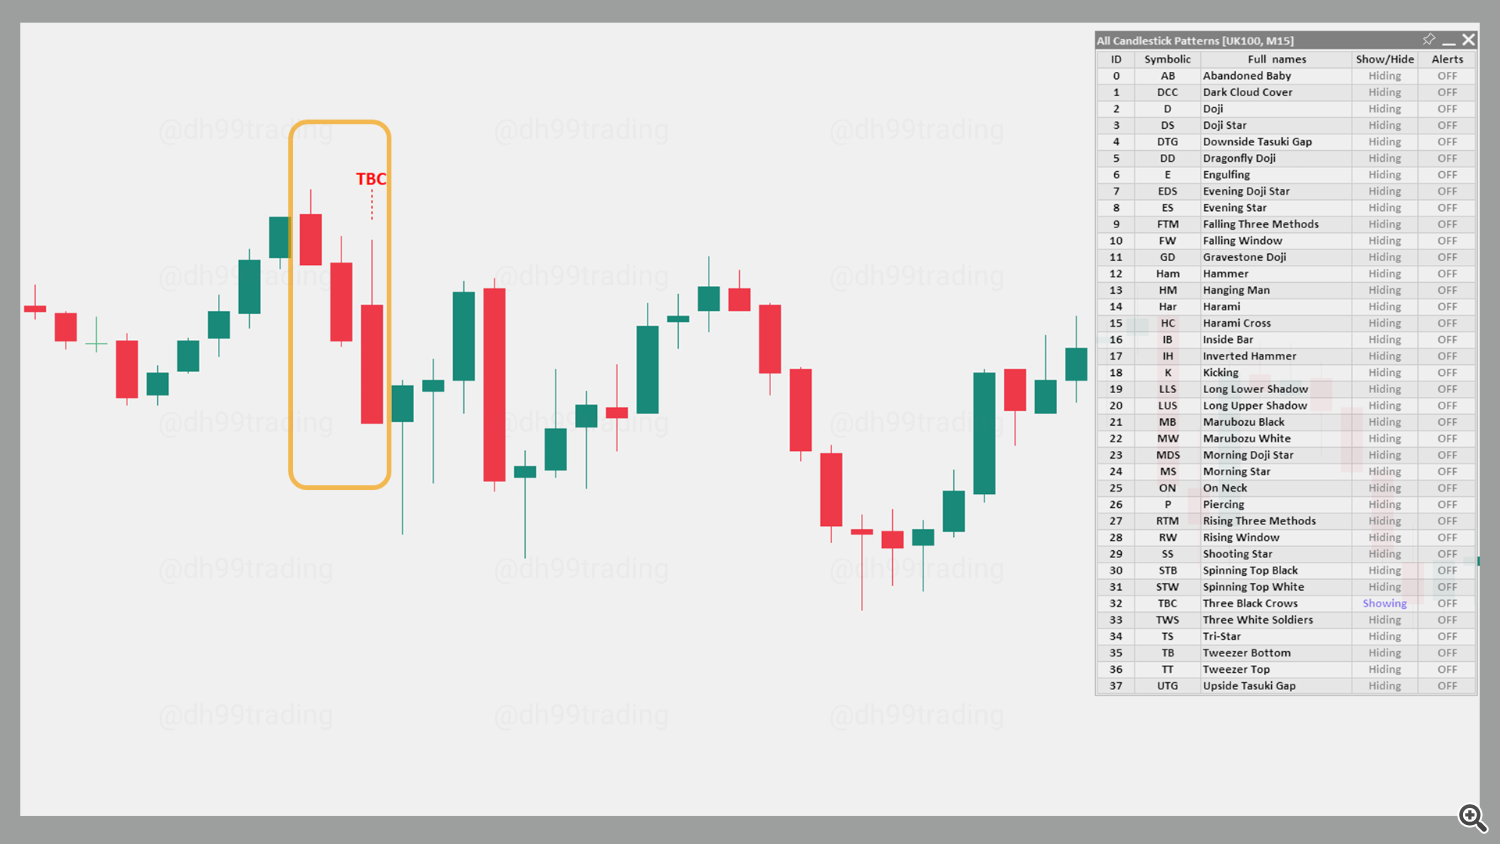
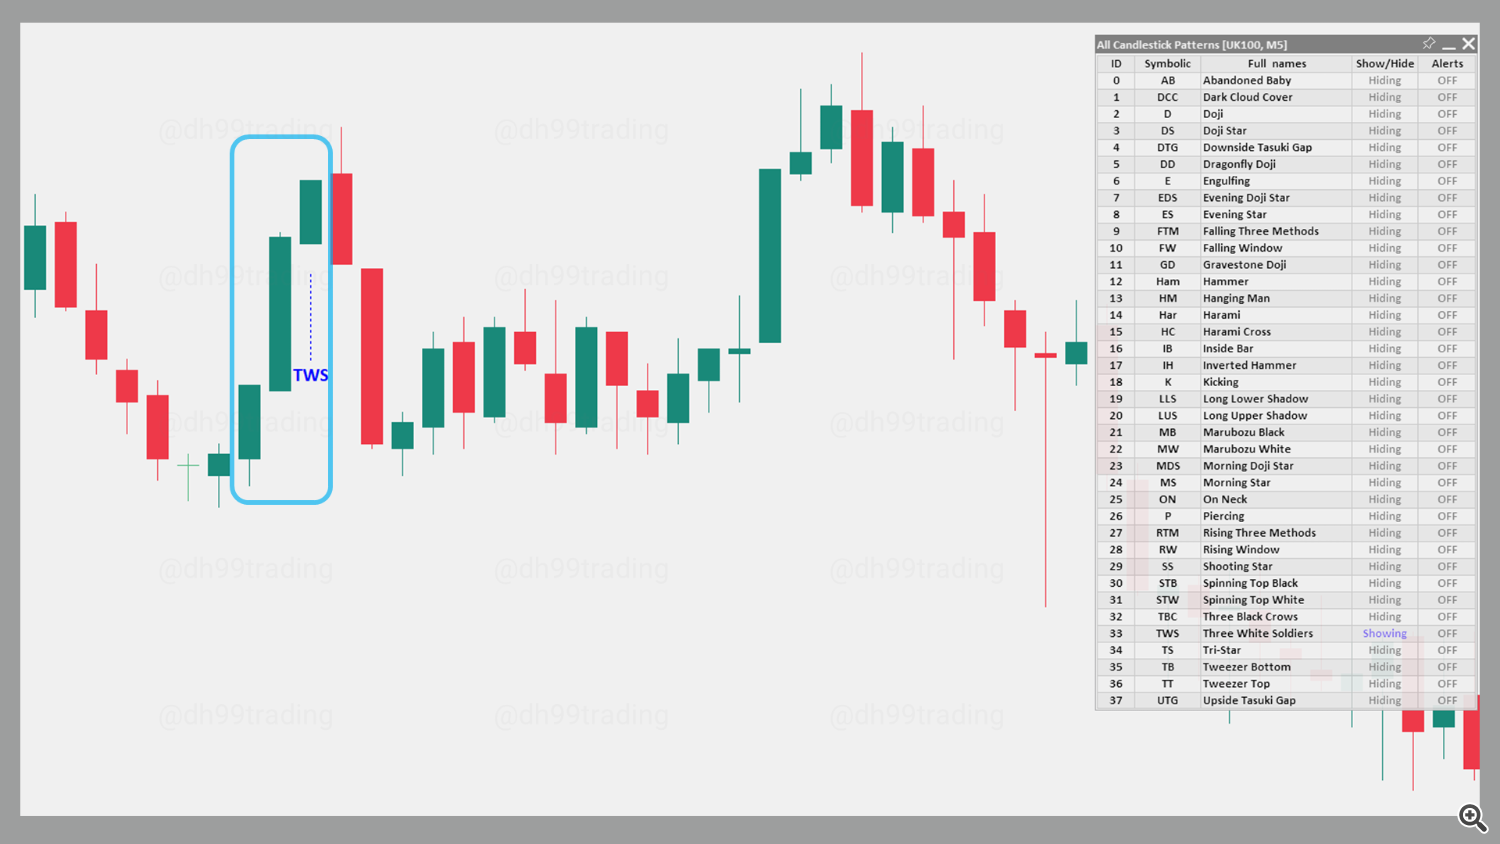
Candlestick Patterns are essential tools that help investors identify trends and reversal points in financial markets. From basic patterns like the Doji to more complex ones like the Engulfing and Three Line Strike, each pattern provides specific signals regarding price movements. Understanding and correctly applying candlestick patterns not only enhances analytical skills but also increases decision-making effectiveness in trading.
All Candlestick Patterns is a powerful tool that fully supports the identification of candlestick patterns on your chart, allowing you to effortlessly track critical signals without the need for manual searching. This tool is especially useful when you need a quick assessment of reversal or trend continuation signals based on each candlestick pattern. It helps save time and improves decision accuracy.
See more about the All Candlestick Patterns indicator here:
– MT5 version: All Candlestick Patterns MT5
– MT4 version: All Candlestick Patterns MT4
Below are some popular candlestick patterns and their meanings:
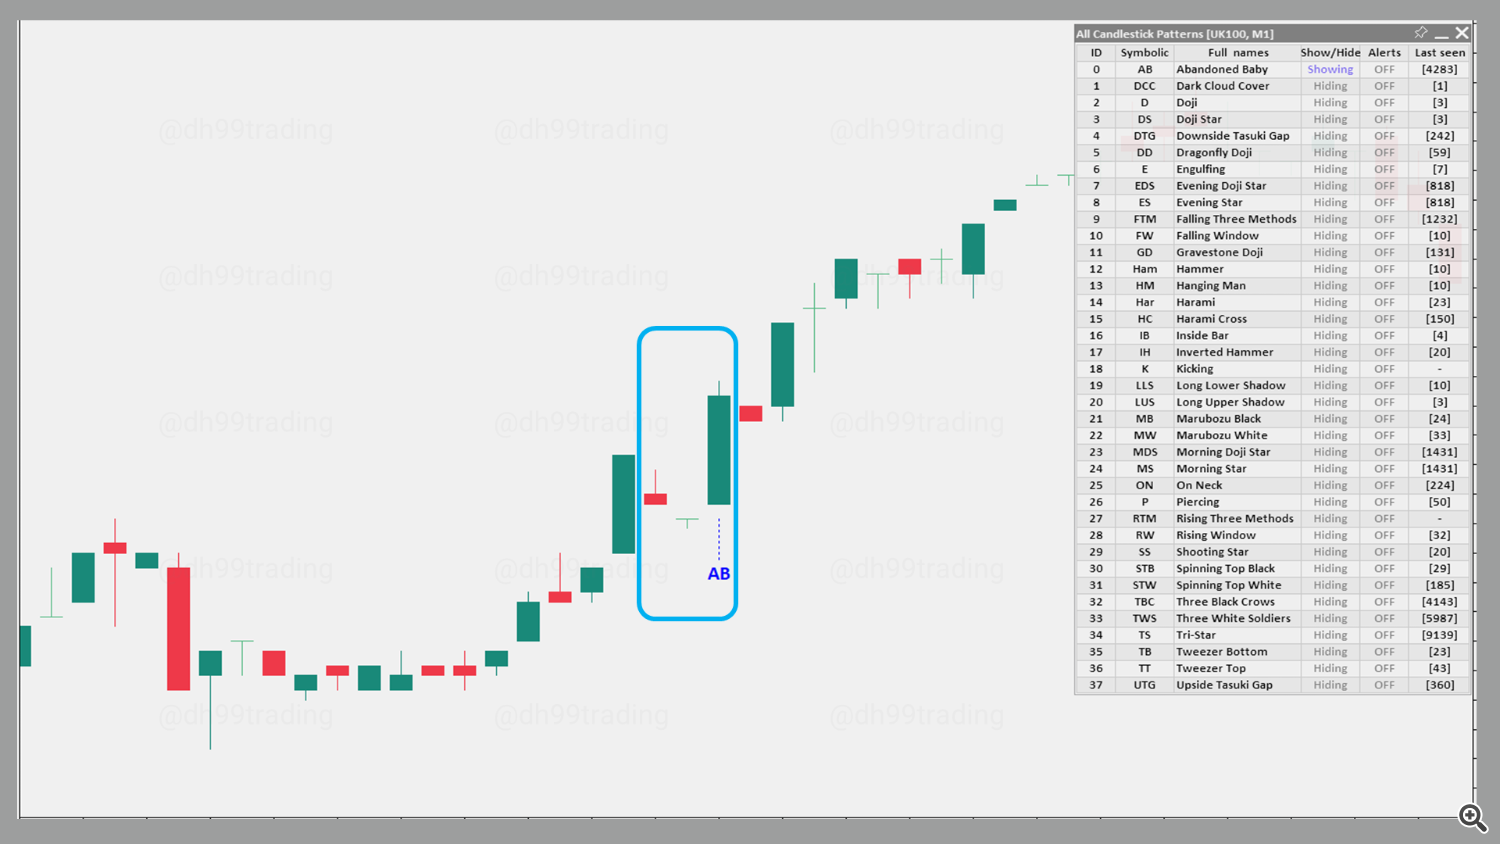
A bearish abandoned baby is a specific candlestick pattern that often signals a downward reversal trend in terms of security price. It is formed when a gap appears between the lowest price of a doji-like candle and the candlestick of the day before. The earlier candlestick is green, tall, and has small shadows. The doji candle is also tailed by a gap between its lowest price point and the highest price point of the candle that comes next, which is red, tall and also has small shadows. The doji candle shadows must completely gap either below or above the shadows of the first and third day in order to have the abandoned baby pattern effect.
The bullish version of the Abandoned Baby pattern is the Bullish Abandoned Baby pattern.
2. Abandoned Baby – Bullish
A bullish Abandoned Baby candlestick pattern is quite rare as far as reversal patterns go. It forms during a downtrend and consists of three price bars. The first of the pattern is a large down candle. Next comes a doji candle that gaps below the candle before it. The doji candle is then followed by another candle that opens even higher and swiftly moves to the upside.
The bearish version of the Abandoned Baby pattern is the Bearish Abandoned Baby pattern.
3. Dark Cloud Cover – Bearish
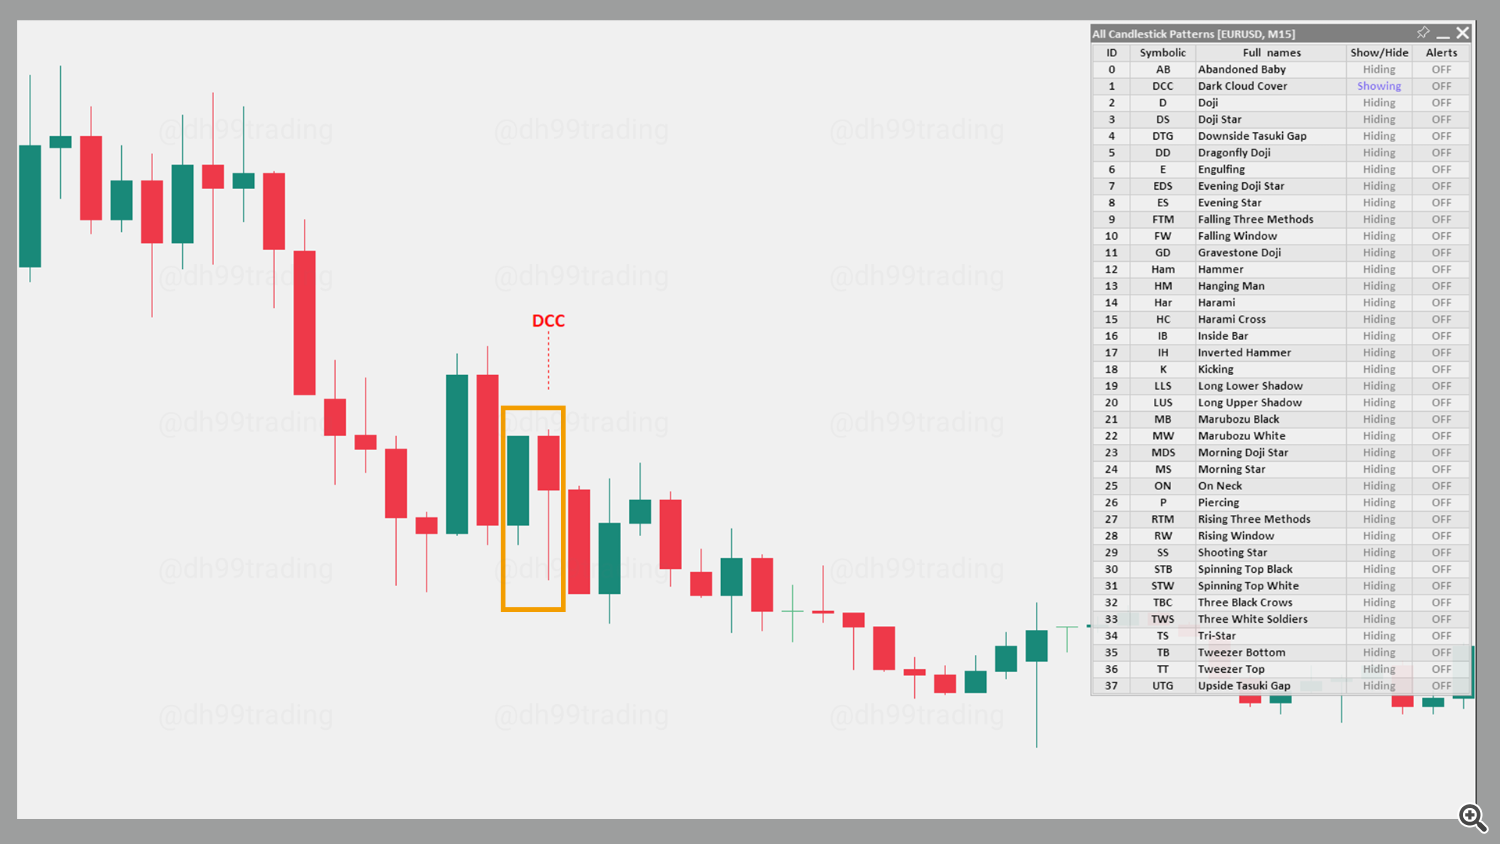
Dark Cloud Cover is a two-candle bearish reversal candlestick pattern found in an uptrend. The first candle is green and has a larger than average body. The second candle is red and opens above the high of the prior candle, creating a gap, and then closes below the midpoint of the first candle. This pattern shows a possible shift in the momentum from the upside to the downside, indicating that a reversal might happen soon.
The bullish version of the Dark Cloud Cover pattern is the Piercing candlestick pattern.
4. Piercing – Bullish
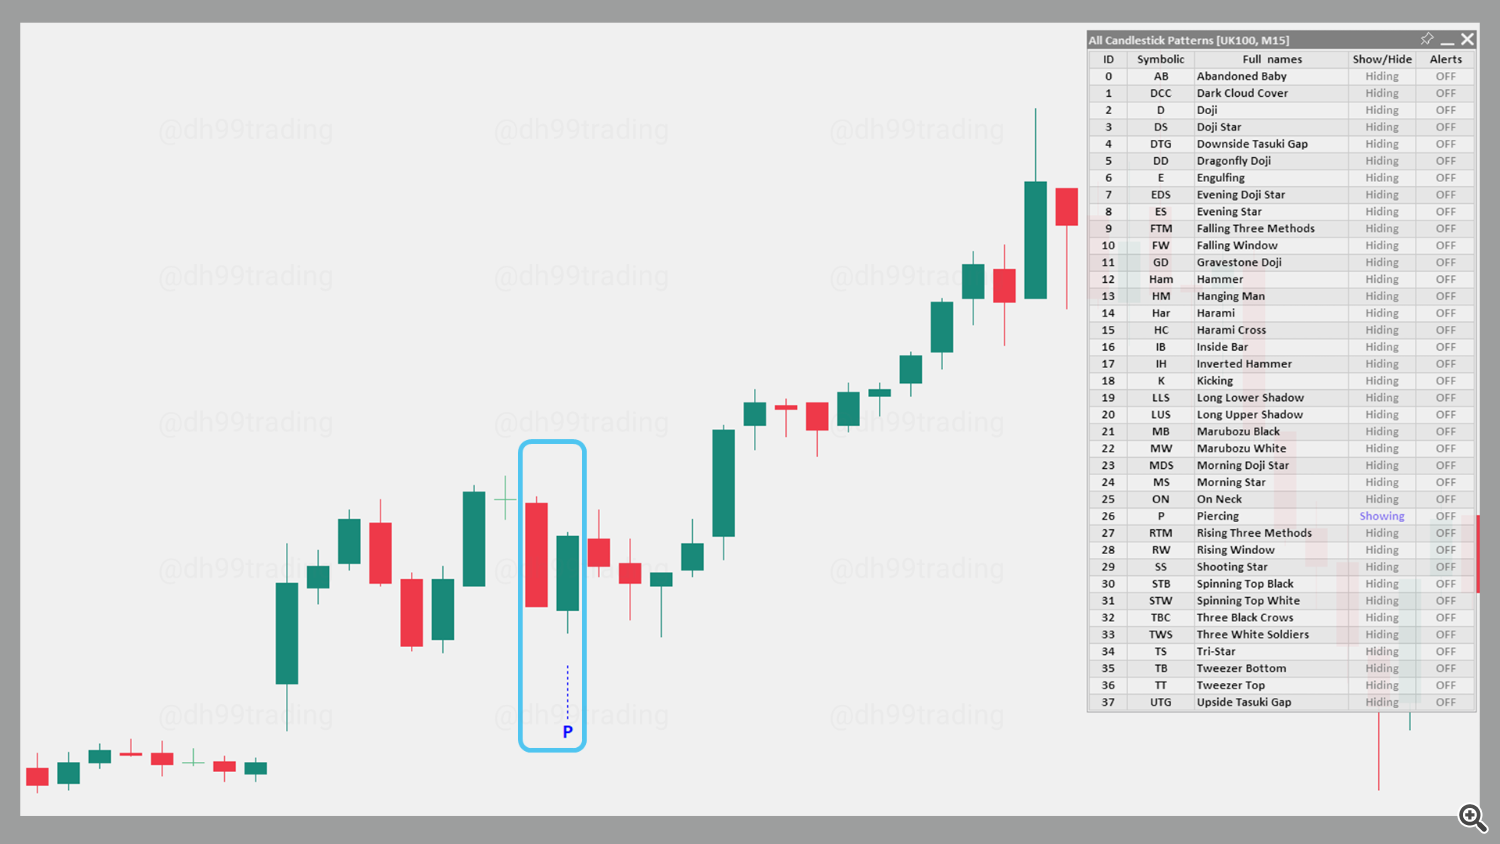
Piercing is a two-candle bullish reversal candlestick pattern found in a downtrend. The first candle is red and has a larger than average body. The second candle is green and opens below the low of the prior candle, creating a gap, and then closes above the midpoint of the first candle. This pattern shows a possible shift in the momentum from the downside to the upside, indicating that a reversal might happen soon.
The bearish version of the Piercing pattern is the Dark Cloud Cover candlestick pattern.
5. Doji
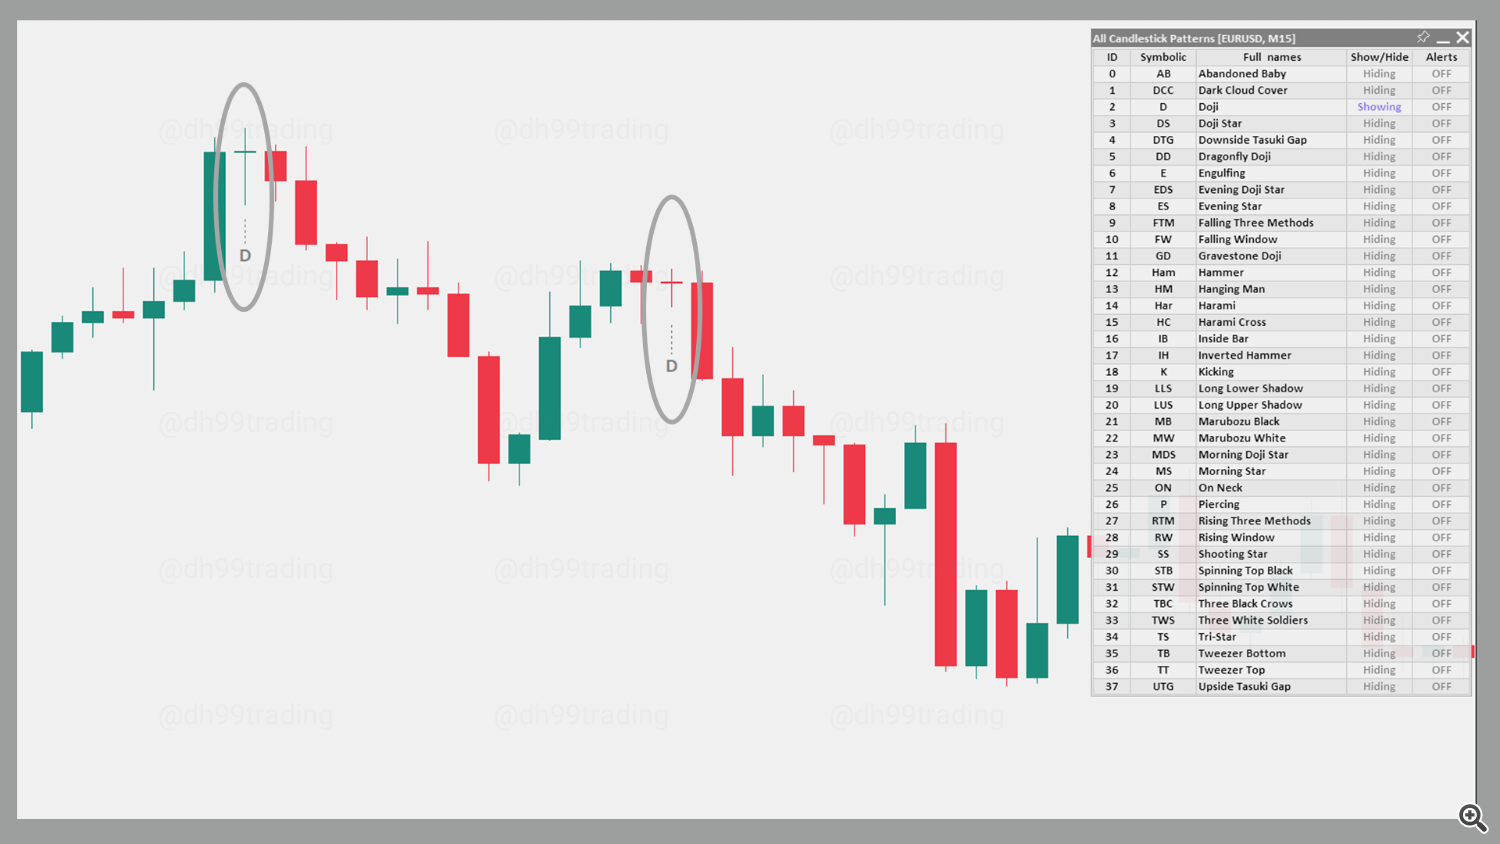
A doji candle forms when the open and close of a security are essentially equal to each other. The length of both upper and lower shadows may vary, causing the candlestick to either resemble a cross, an inverted cross, or a plus sign. Doji candles indicate indecision in the market as buyers and sellers compete for control.
Doji is often used as a neutral pattern but can hint at potential reversals in specific contexts.
6. Doji Star – Bearish
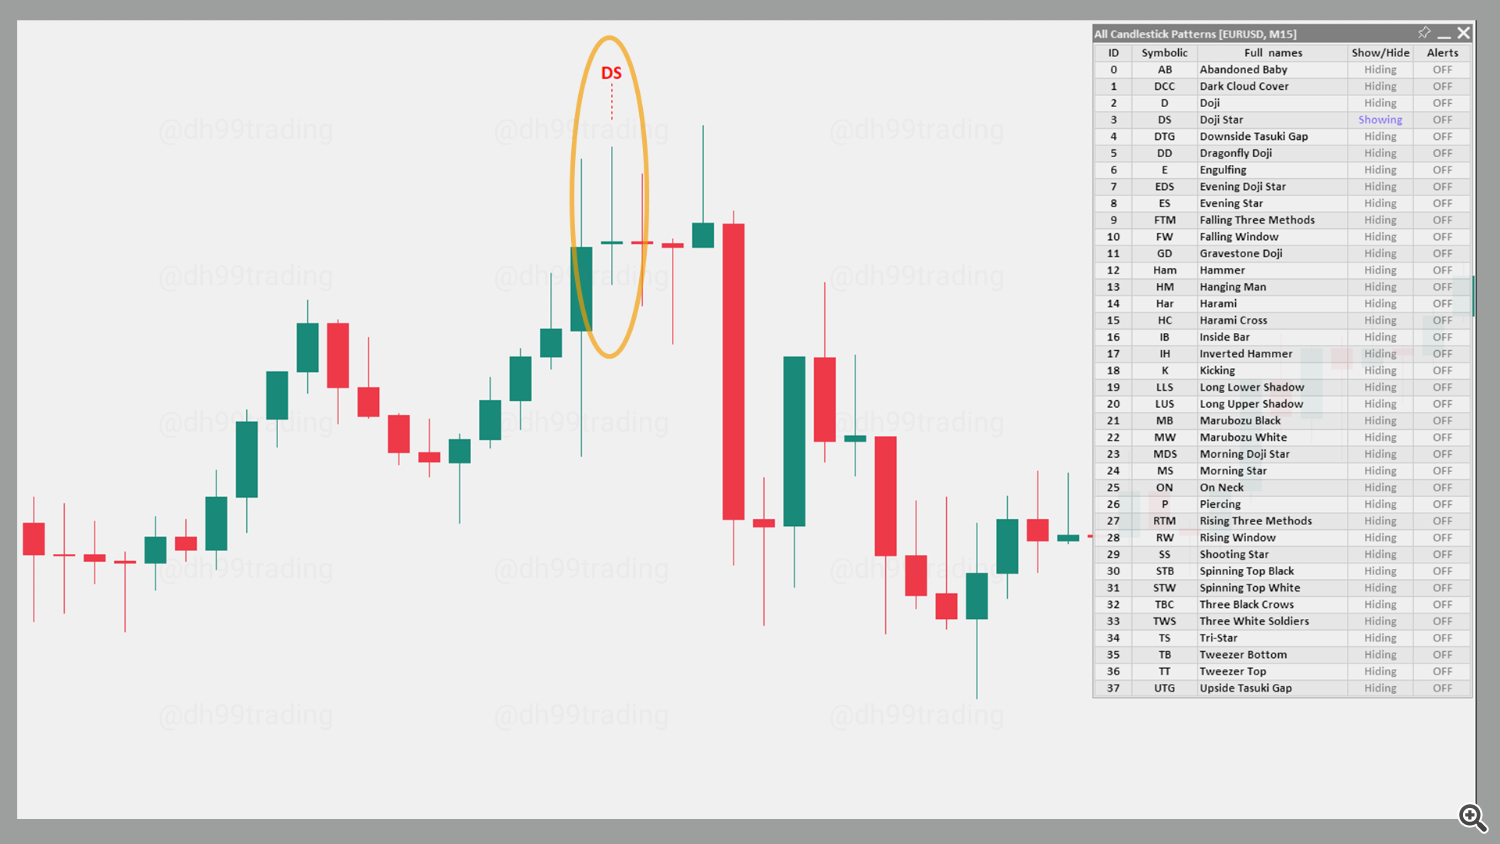
The Bearish Doji Star is a two-candle pattern often found in an uptrend. It consists of a long green candle followed by a Doji candle that opens above the body of the first one, creating a gap. This pattern suggests a reversal signal with potential confirmation on the next trading day.
The bullish version of the Doji Star pattern is the Bullish Doji Star pattern.
7. Doji Star – Bullish
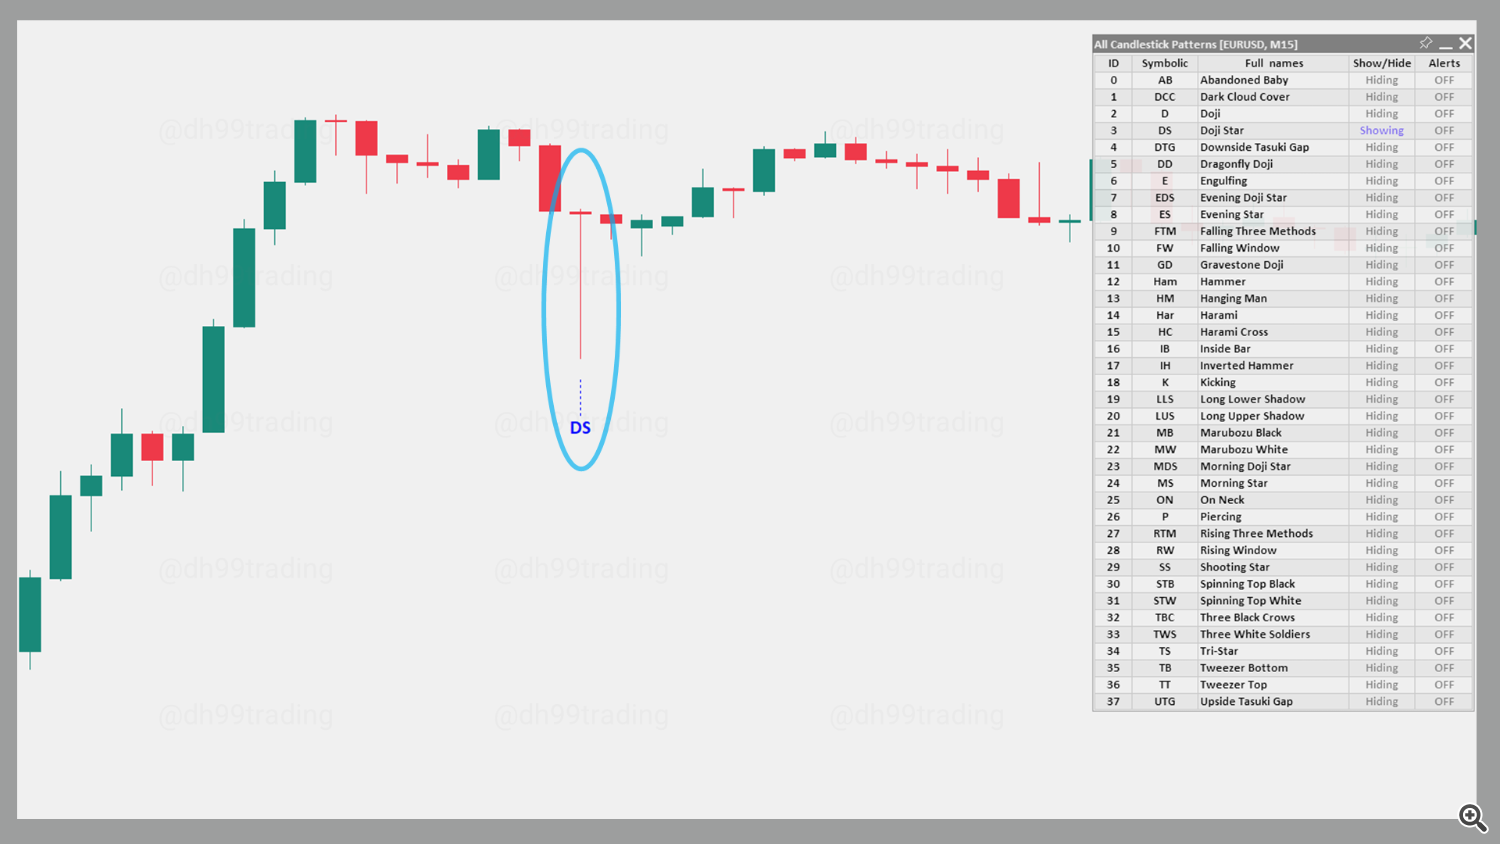
The Bullish Doji Star is a two-candle pattern commonly found in a downtrend. The pattern consists of a long red candle, followed by a Doji candle that opens below the body of the first candle, creating a gap. It indicates potential reversal with confirmation from the next day’s trading.
The bearish version of the Doji Star pattern is the Bearish Doji Star pattern.
8. Downside Tasuki Gap – Bearish
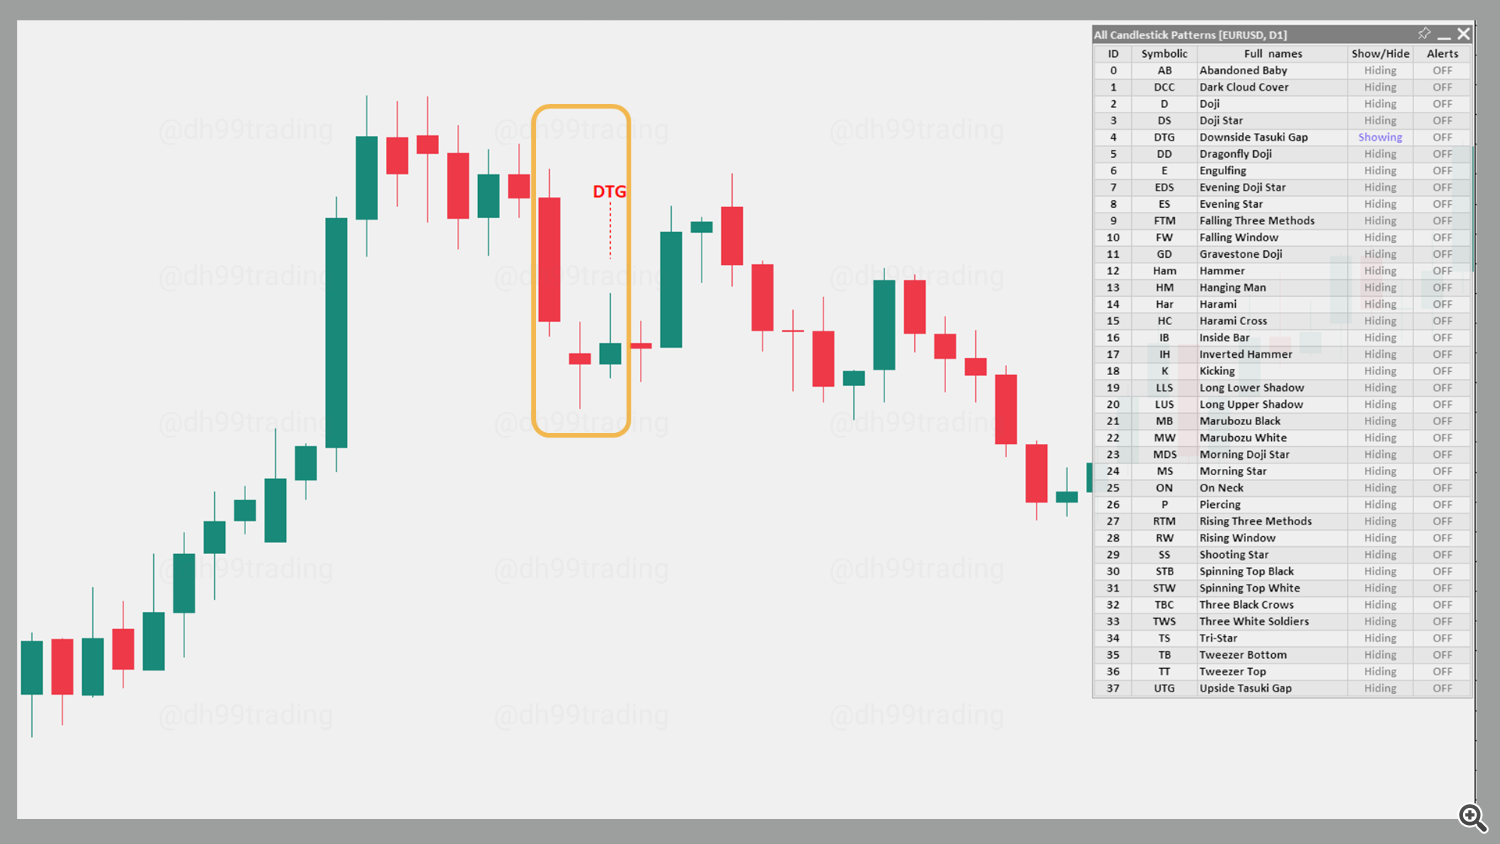
The Downside Tasuki Gap is a three-candle pattern found in a downtrend, suggesting a continuation of the bearish trend. The first two candles are long and red, with the second one opening with a gap below the first. The third candle is green and closes within the gap but does not close it completely, indicating that the downtrend may continue.
The bullish counterpart to this pattern is the Upside Tasuki Gap pattern.
9. Upside Tasuki Gap – Bullish
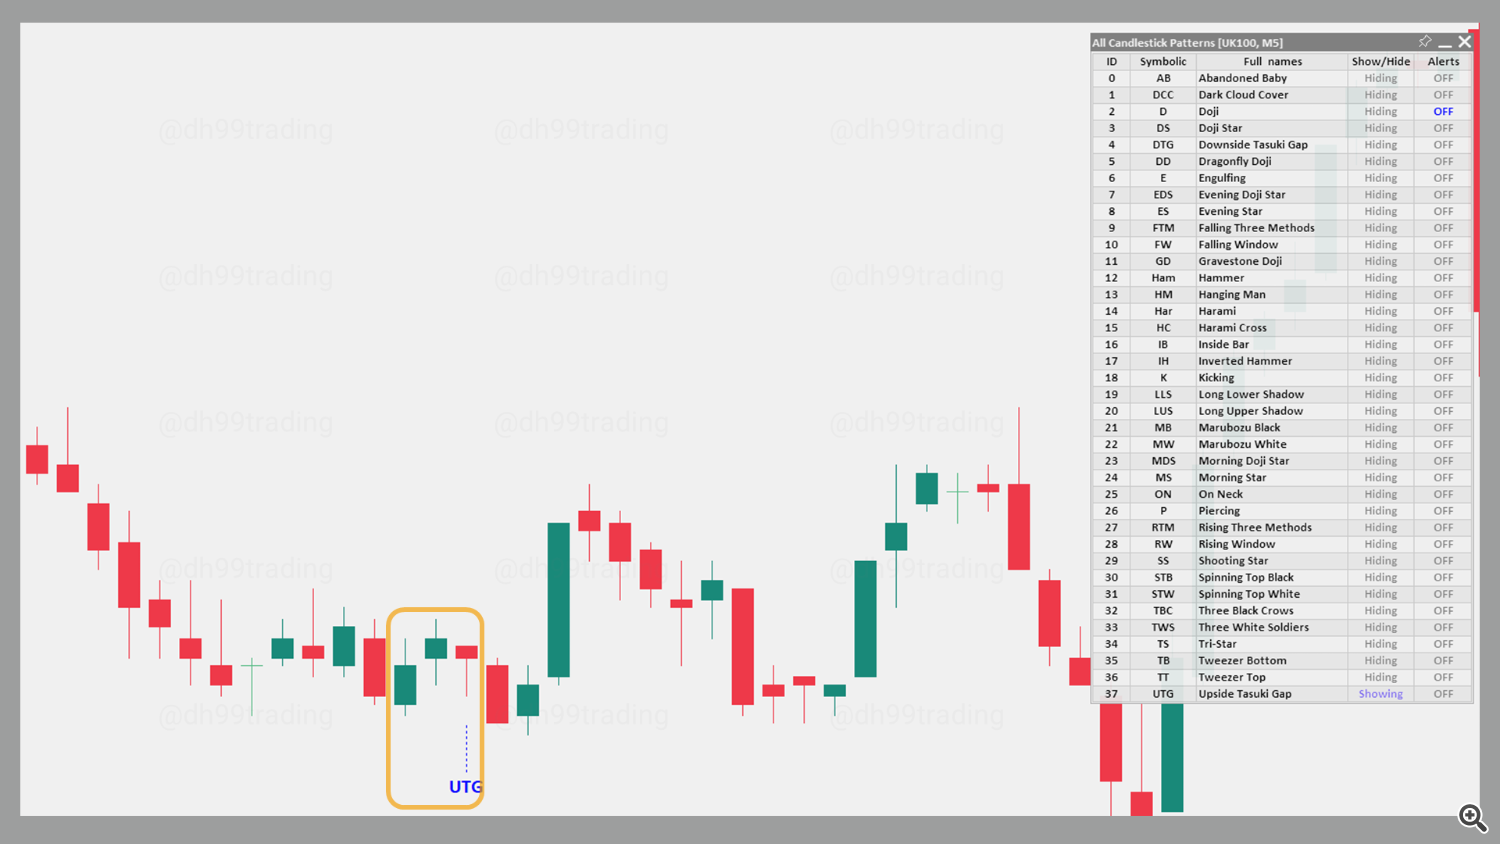
The Upside Tasuki Gap is a three-candle bullish continuation pattern found in an uptrend. It consists of two long green candles, with the second candle opening above the close of the first, creating a gap. The third candle is red and closes within the gap but does not close it entirely, suggesting that the uptrend may continue.
The bearish counterpart to this pattern is the Downside Tasuki Gap pattern.
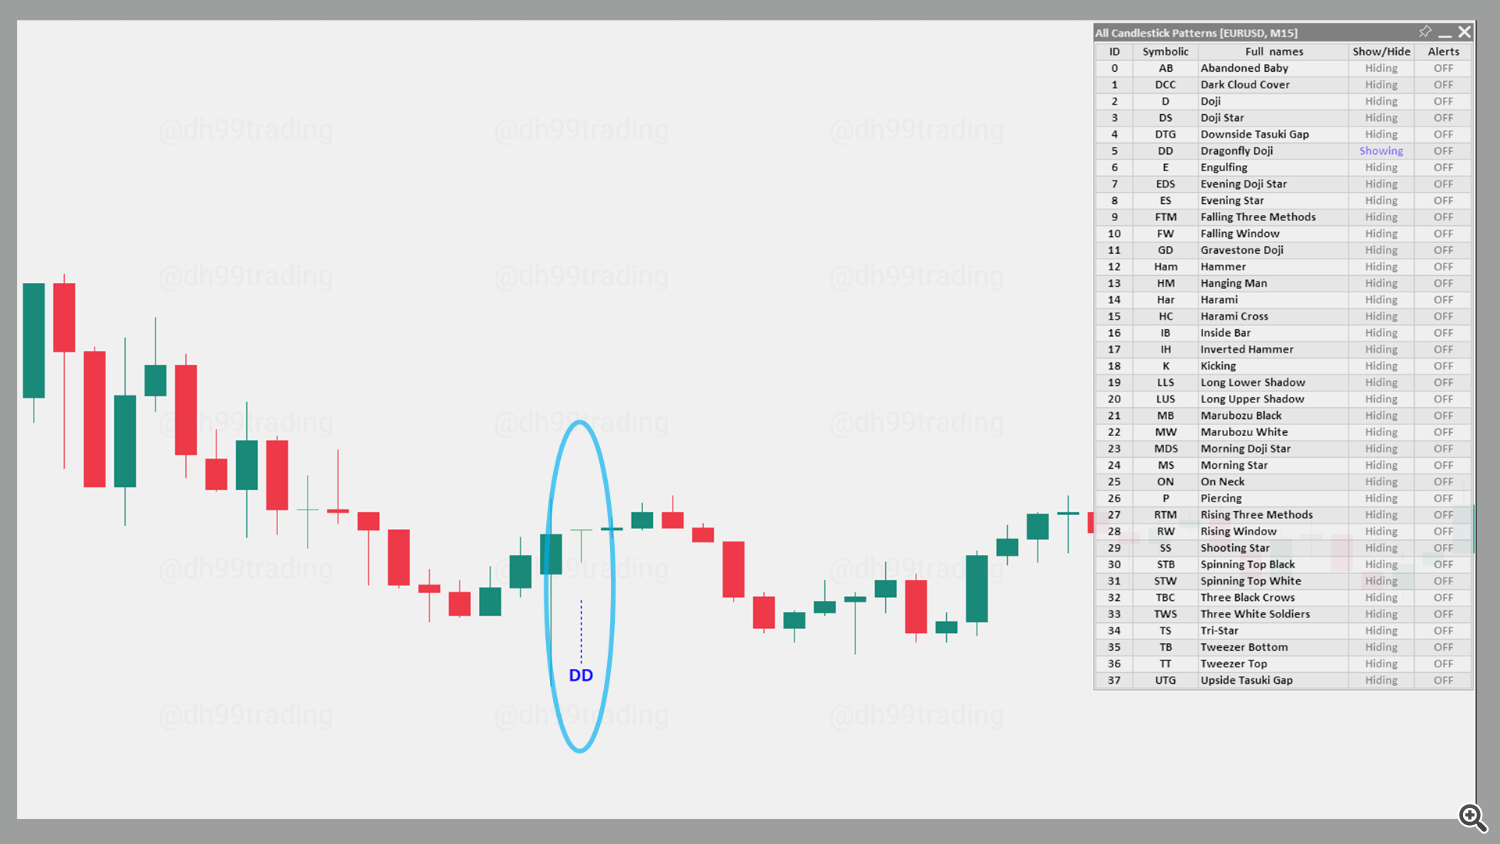
10. Dragonfly Doji – Bullish
The Dragonfly Doji is a specific Doji where the open and close are at the high of the session, leaving a long lower shadow. This pattern indicates that buyers regained control after sellers pushed prices lower, and can often suggest a bullish reversal, particularly when found at support levels.
The bearish version of this pattern is the Gravestone Doji.
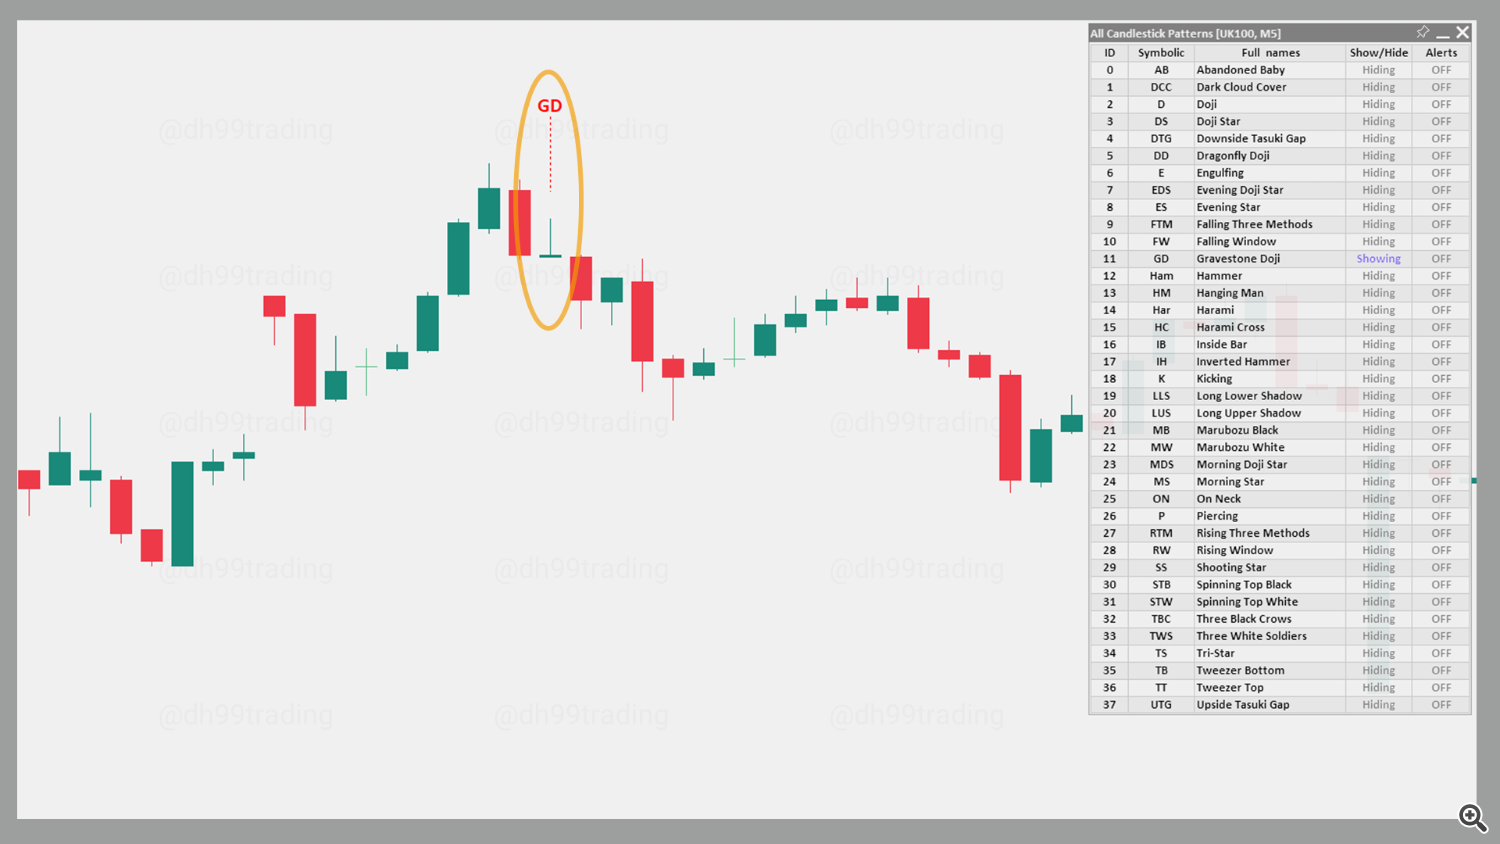
11. Gravestone Doji – Bearish
The Gravestone Doji is a bearish pattern where the open and close are at or near the low of the session, with a long upper shadow. This pattern suggests that buyers pushed prices higher initially, but sellers regained control, pushing the price back down. It can signal a bearish reversal, especially at resistance levels.
The bullish version of this pattern is the Dragonfly Doji.
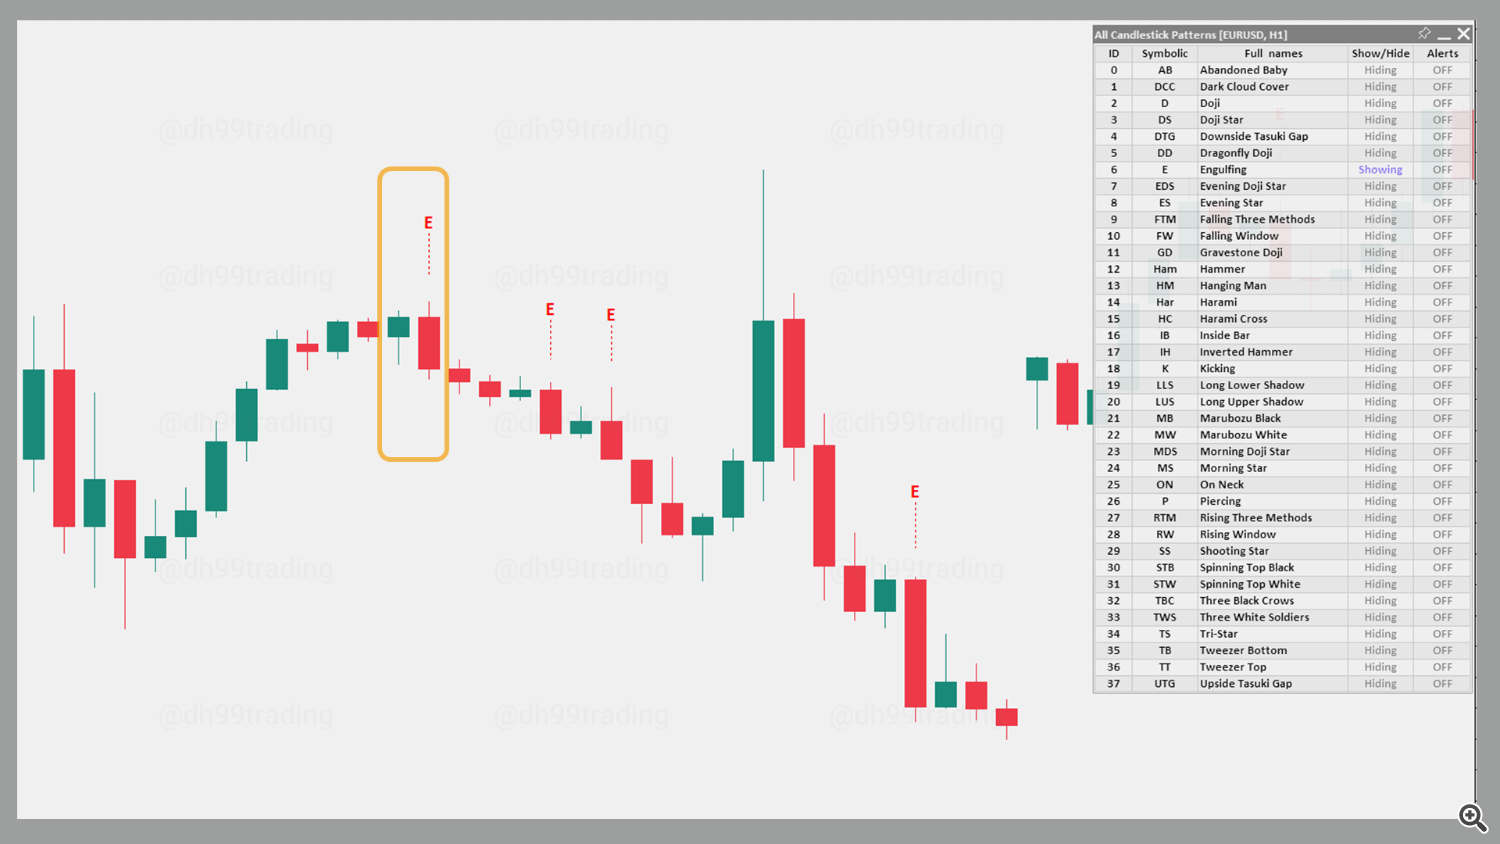
12. Engulfing – Bearish
The Bearish Engulfing pattern is a two-candle reversal pattern typically found at the end of an uptrend. The first candle is green and smaller, while the second candle is red and fully engulfs the body of the previous candle, indicating a shift from bullish to bearish sentiment.
The bullish version of this pattern is the Bullish Engulfing pattern.
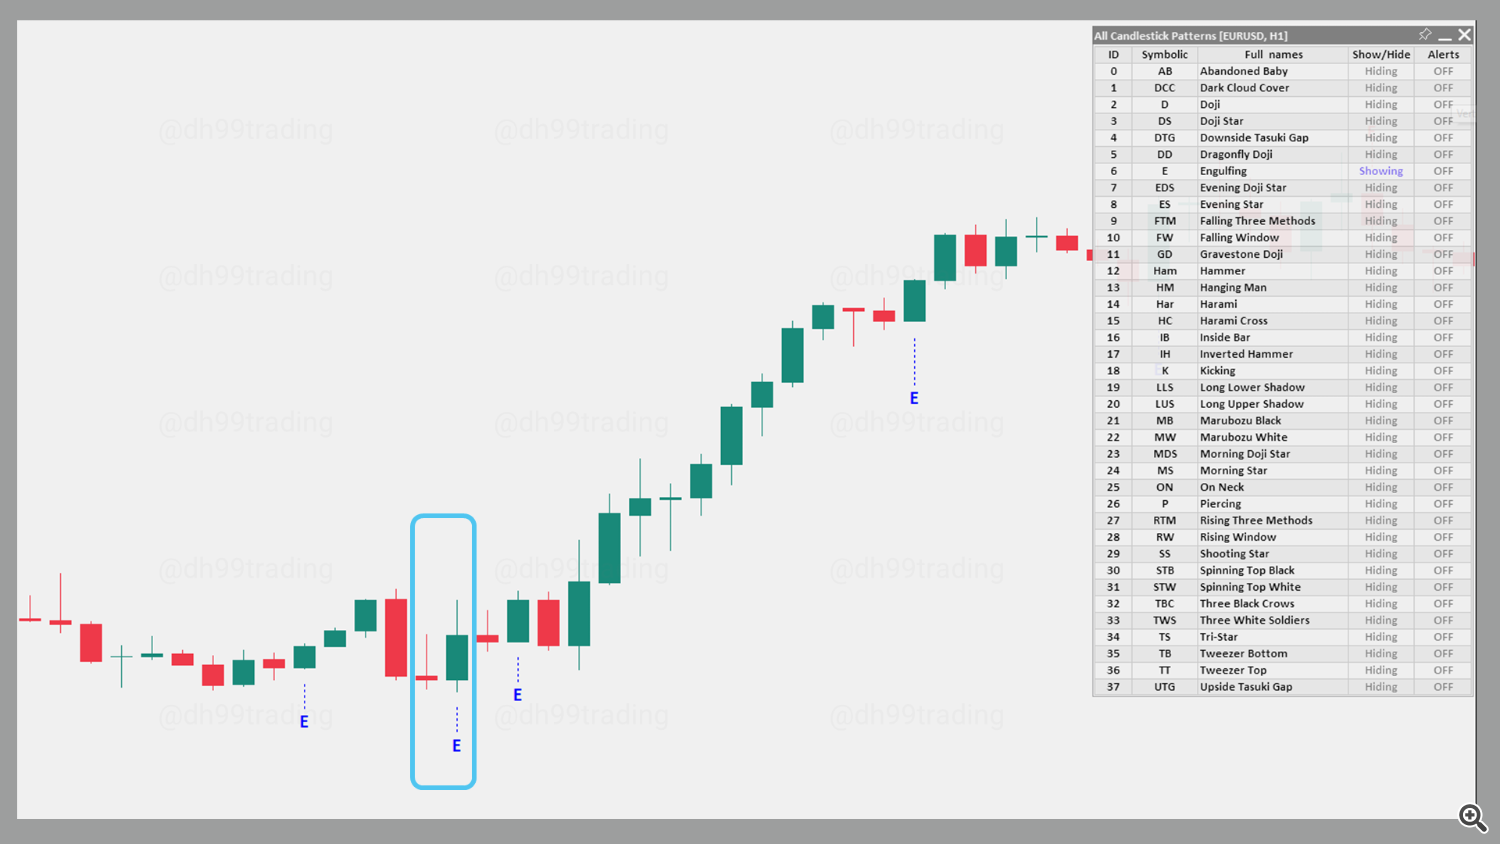
13. Engulfing – Bullish
The Bullish Engulfing pattern is a two-candle reversal pattern often found at the end of a downtrend. The first candle is red and smaller, while the second candle is green and fully engulfs the body of the previous candle, indicating a shift from bearish to bullish sentiment.
The bearish version of this pattern is the Bearish Engulfing pattern.
14. Evening Doji Star – Bearish
The Evening Doji Star is a three-candle pattern that begins with a long green candle in an uptrend, followed by a Doji that gaps up, and concludes with a red candle that closes below the midpoint of the first. This pattern suggests a strong reversal as bullish momentum fades and selling pressure takes over.
The bullish counterpart to this pattern is the Morning Doji Star pattern.
15. Morning Doji Star – Bullish
The Morning Doji Star is a bullish reversal pattern that consists of a long red candle in a downtrend, followed by a Doji that gaps down, and concludes with a green candle that closes above the midpoint of the first. This pattern suggests a strong reversal as selling pressure fades and buyers regain control.
The bearish counterpart to this pattern is the Evening Doji Star pattern.
16. Evening Star – Bearish
The Evening Star is a bearish reversal pattern that appears during an uptrend and consists of three candles. It begins with a long green candle, followed by a small-bodied candle that gaps higher, and ends with a long red candle closing below the midpoint of the first. This pattern signals a reversal as bullish momentum weakens.
The bullish counterpart to this pattern is the Morning Star pattern.
17. Morning Star – Bullish
The Morning Star is a three-candle bullish reversal pattern typically found at the end of a downtrend. It starts with a long red candle, followed by a short-bodied candle that gaps down, and concludes with a long green candle that closes above the midpoint of the first. This pattern indicates a potential shift from bearish to bullish momentum.
The bearish counterpart to this pattern is the Evening Star pattern.
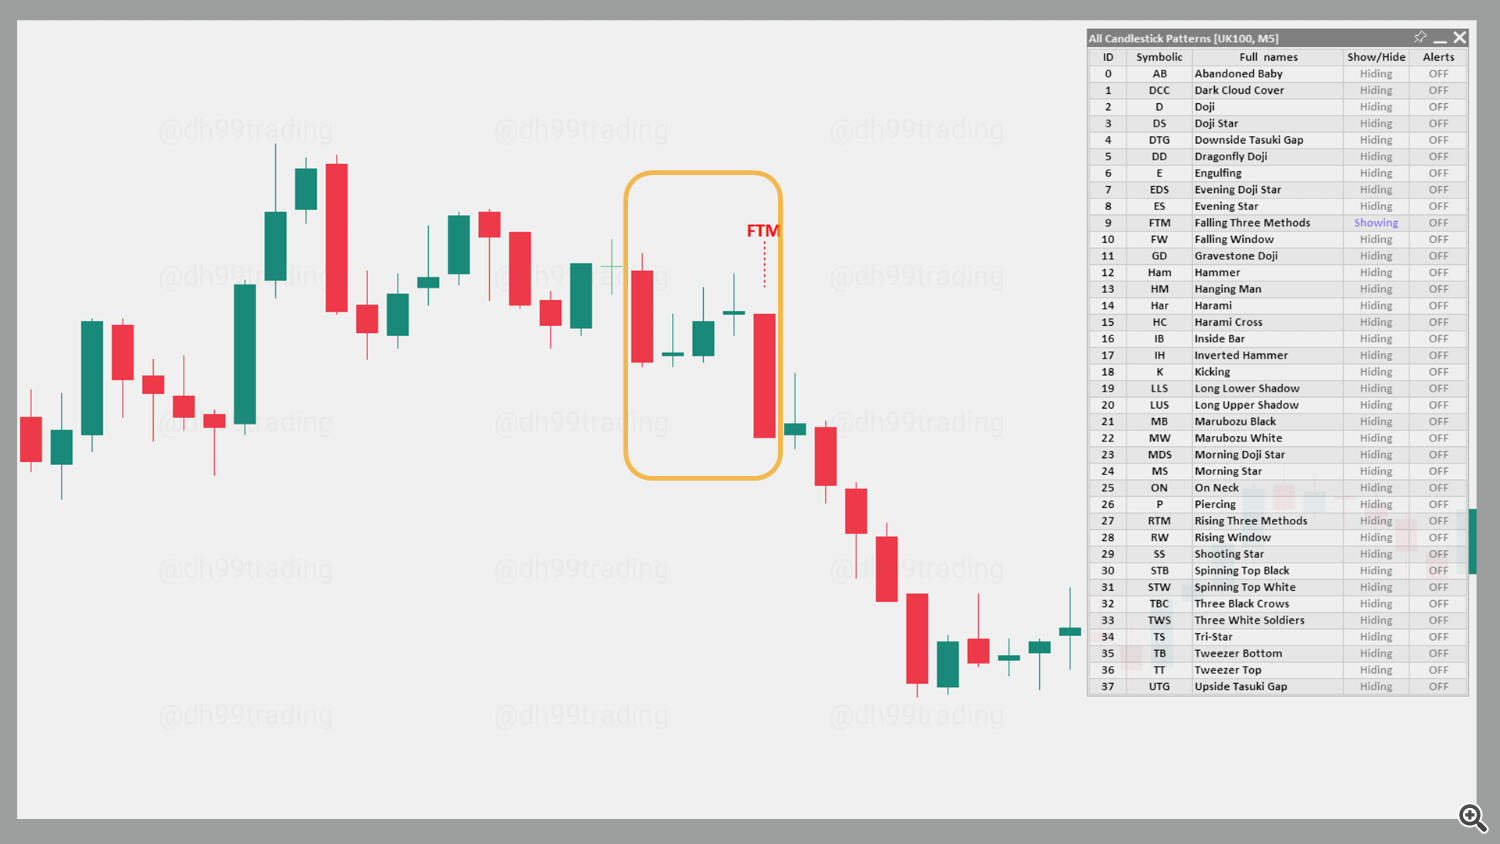
18. Falling Three Methods – Bearish
The Falling Three Methods is a five-candle bearish continuation pattern found in a downtrend. It begins with a long red candle, followed by three short green candles that remain within the range of the first, and concludes with another long red candle closing below the first. This pattern suggests that the downtrend will continue.
The bullish counterpart to this pattern is the Rising Three Methods pattern.
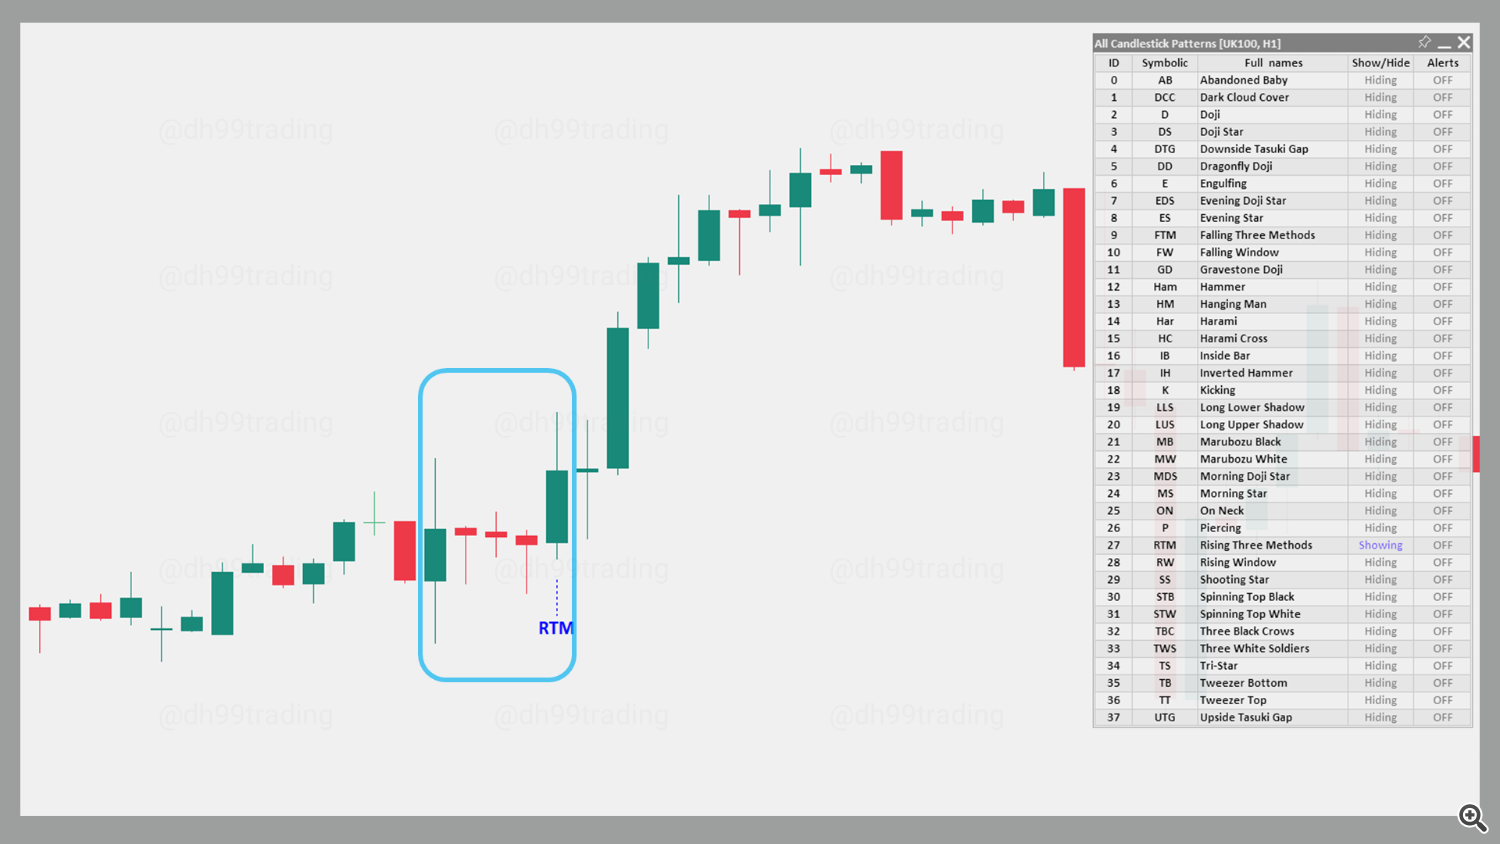
19. Rising Three Methods – Bullish
The Rising Three Methods is a bullish continuation pattern typically found in an uptrend. It starts with a long green candle, followed by three short red candles within the range of the first candle, and ends with a long green candle that closes above the high of the first. This pattern indicates that the uptrend is likely to continue.
The bearish counterpart to this pattern is the Falling Three Methods pattern.
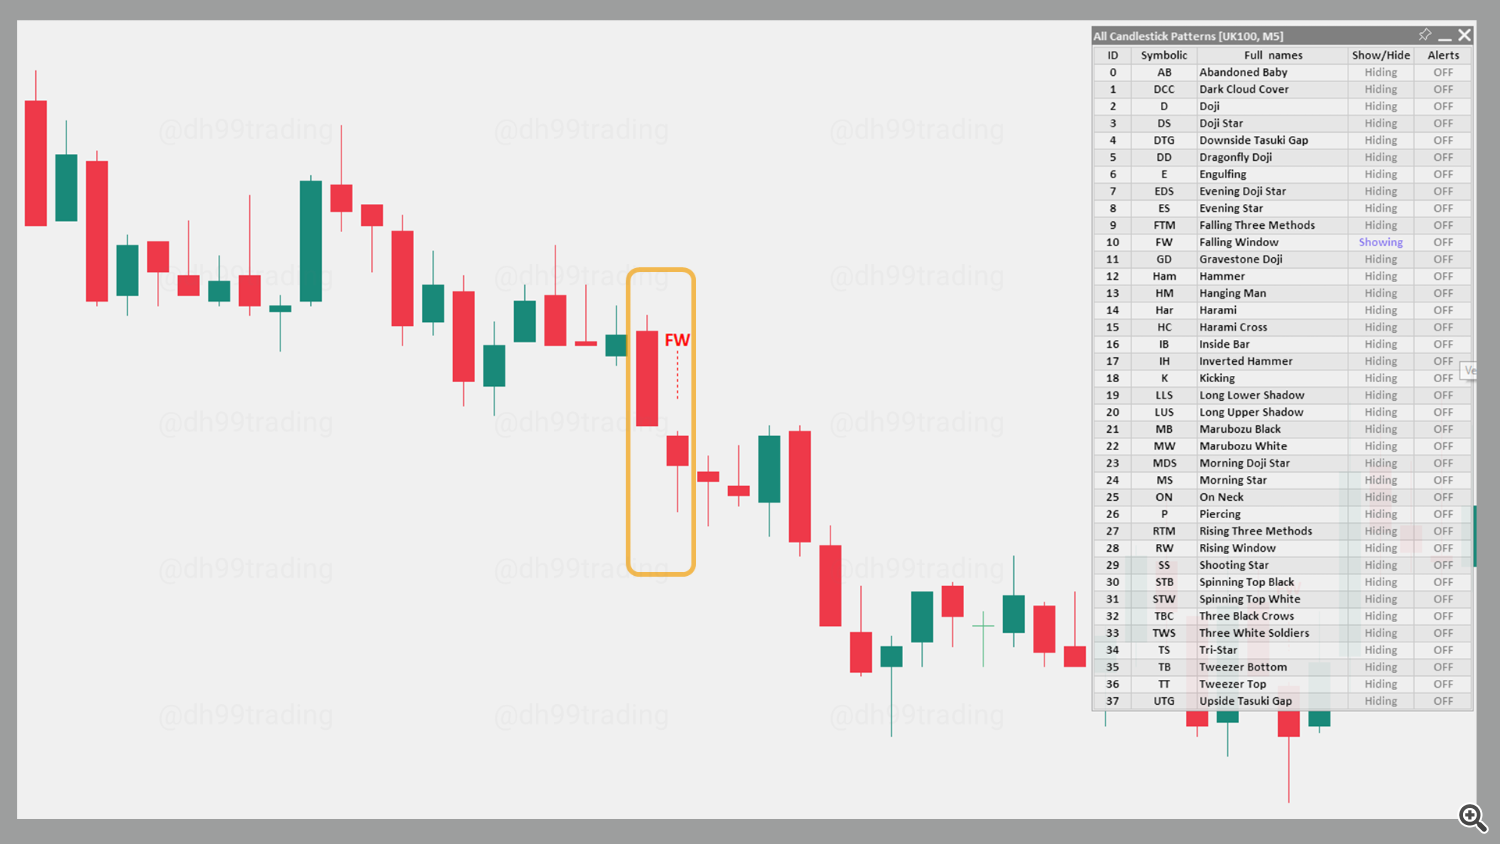
20. Falling Window – Bearish
The Falling Window is a two-candle bearish continuation pattern that forms during a downtrend. The second candle opens with a gap below the low of the first candle, creating a “window.” This pattern indicates that the downtrend will likely continue as the gap acts as resistance.
The bullish counterpart to this pattern is the Rising Window pattern.
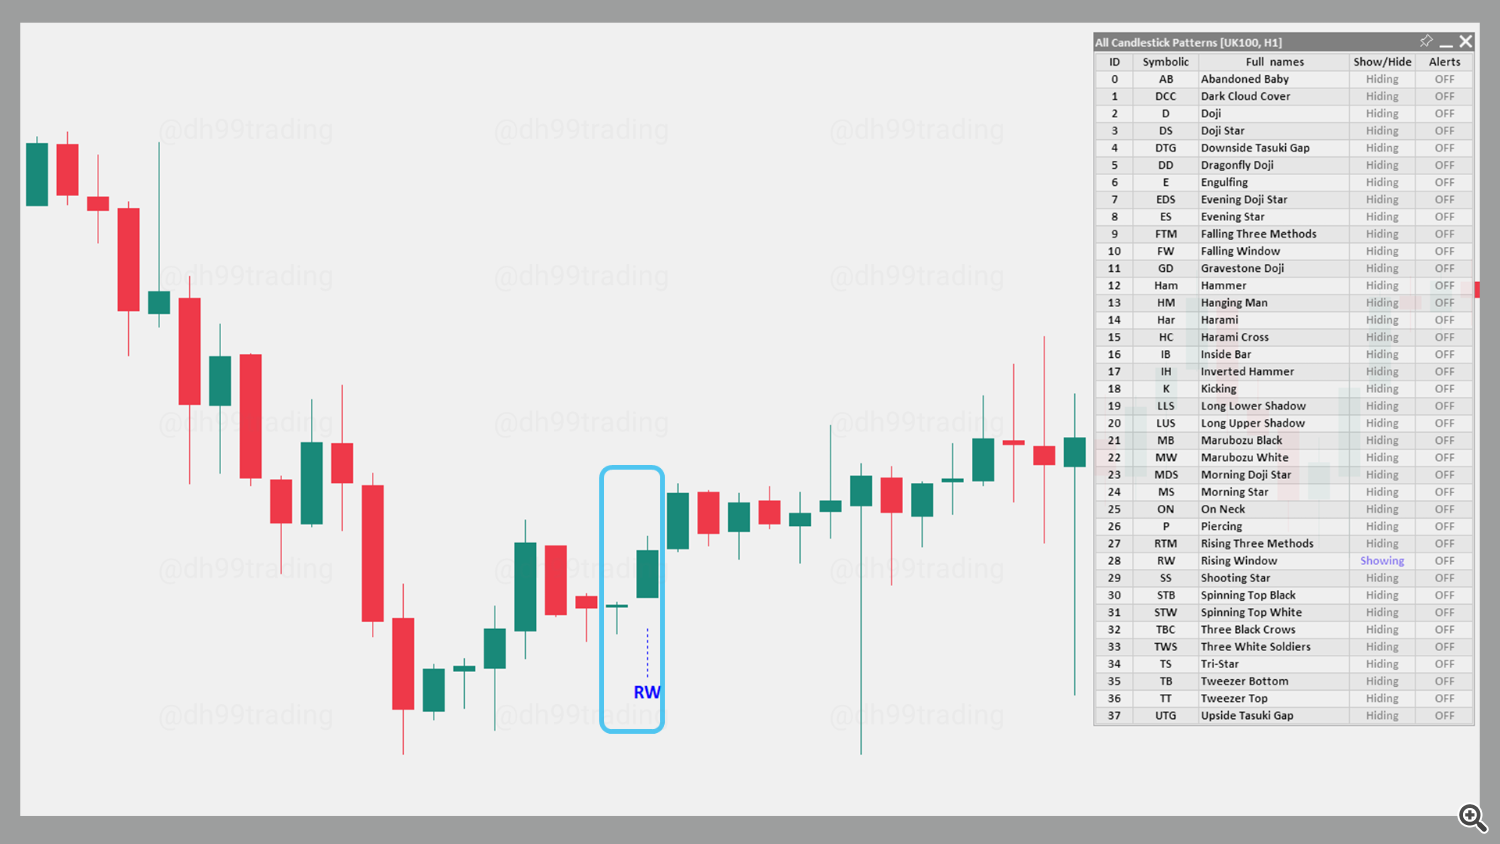
21. Rising Window – Bullish
The Rising Window is a two-candle bullish continuation pattern that forms during an uptrend. The second candle opens with a gap above the high of the first candle, creating a “window.” This pattern suggests that the uptrend will likely continue as the gap acts as support.
The bearish counterpart to this pattern is the Falling Window pattern.
22. Hammer – Bullish
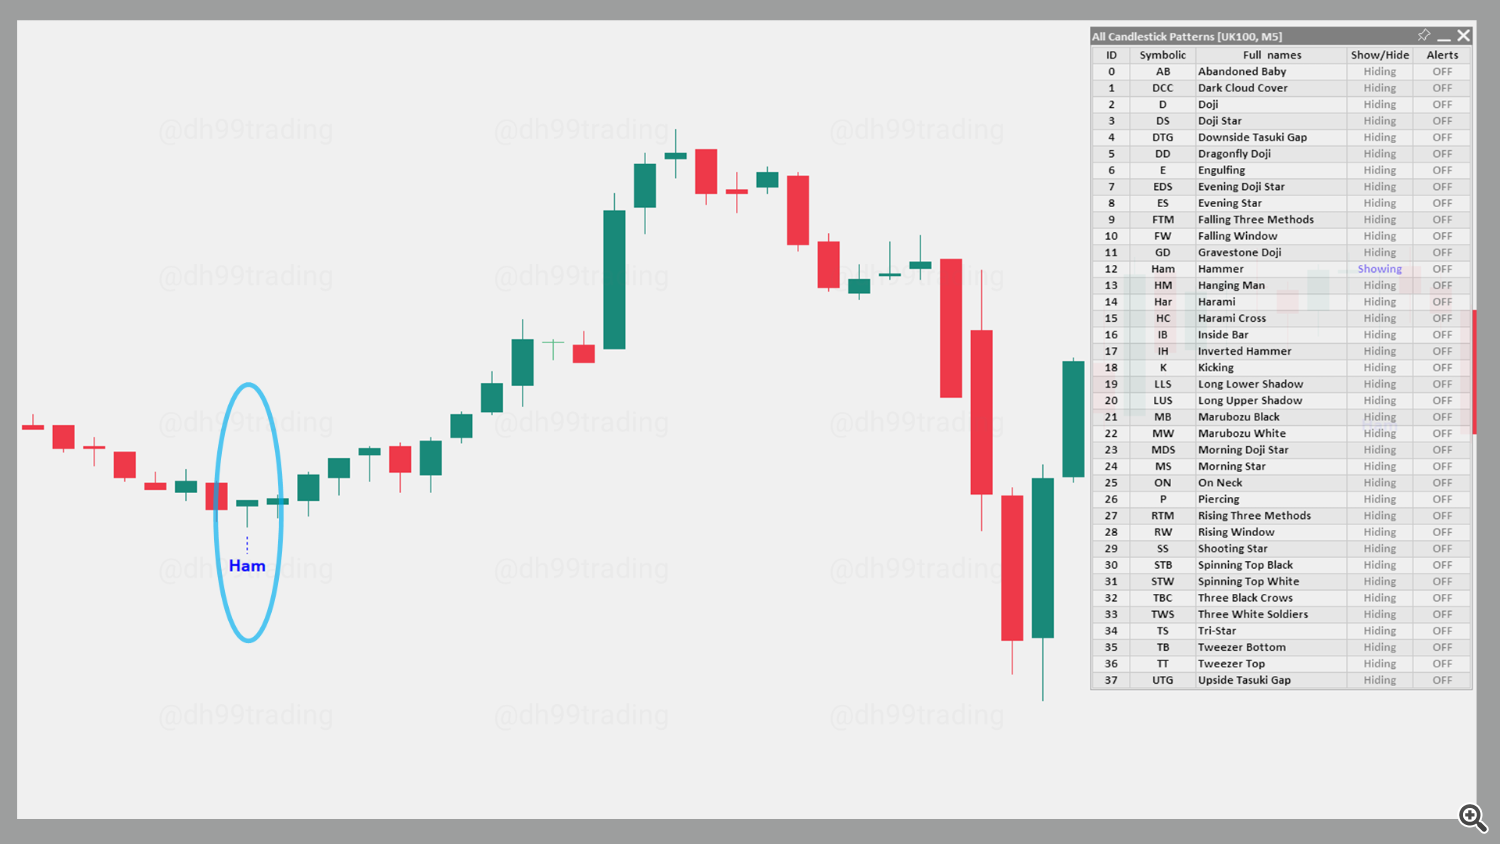
The Hammer is a bullish reversal pattern that forms at the bottom of a downtrend. It has a small body and a long lower shadow, indicating that sellers initially pushed prices lower but buyers regained control, closing the price near the open. This pattern suggests a potential upward reversal.
The bearish counterpart to this pattern is the Hanging Man pattern.
23. Hanging Man – Bearish
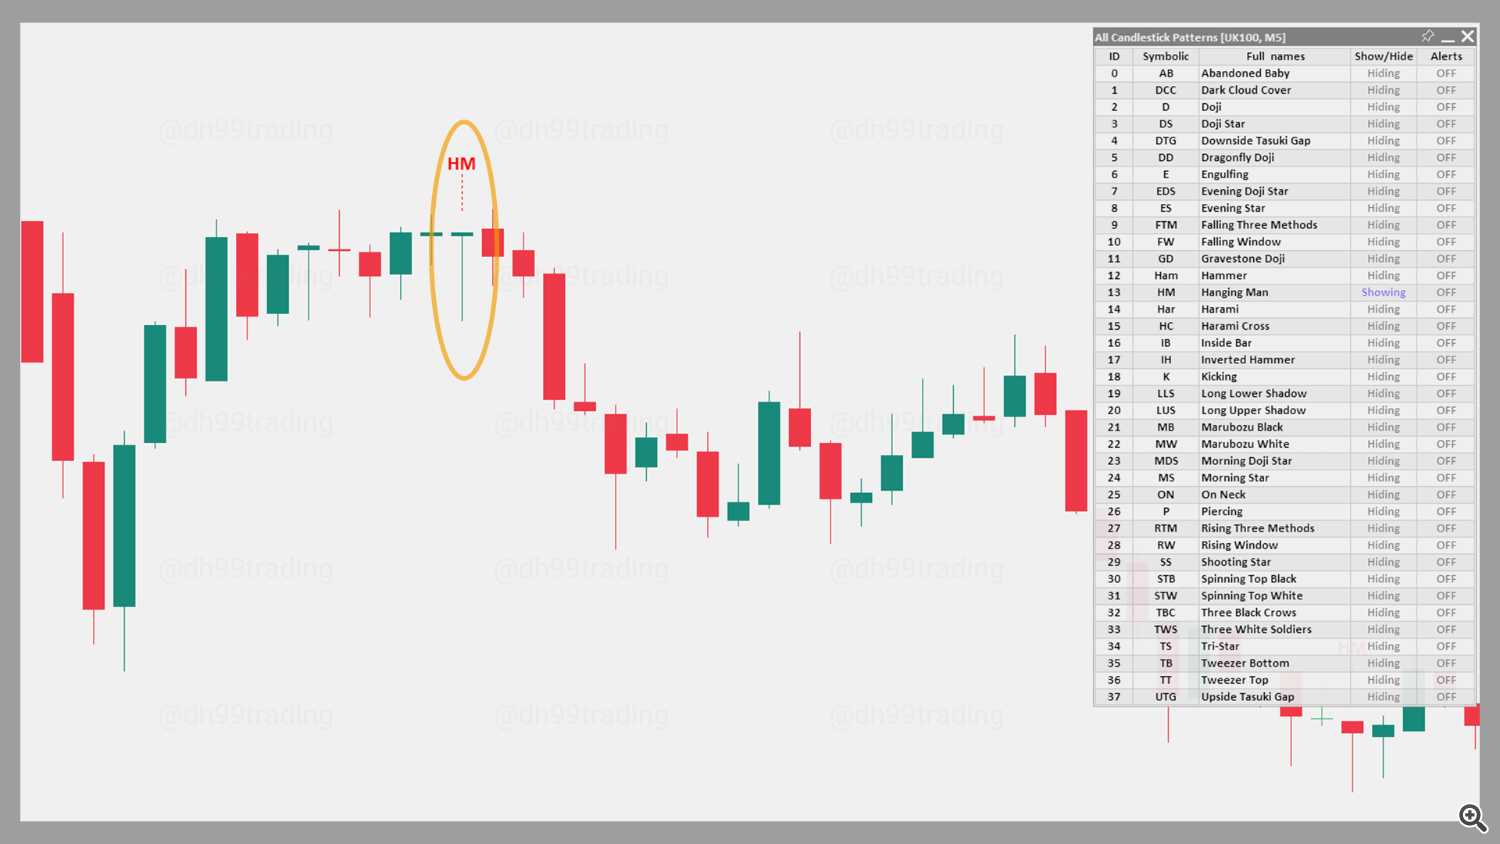
The Hanging Man is a bearish reversal pattern that appears at the top of an uptrend. It has a small body and a long lower shadow, similar in appearance to the Hammer, but signals the opposite trend. This pattern suggests a potential reversal if followed by a bearish candle.
The bullish counterpart to this pattern is the Hammer pattern.
24. Harami – Bearish
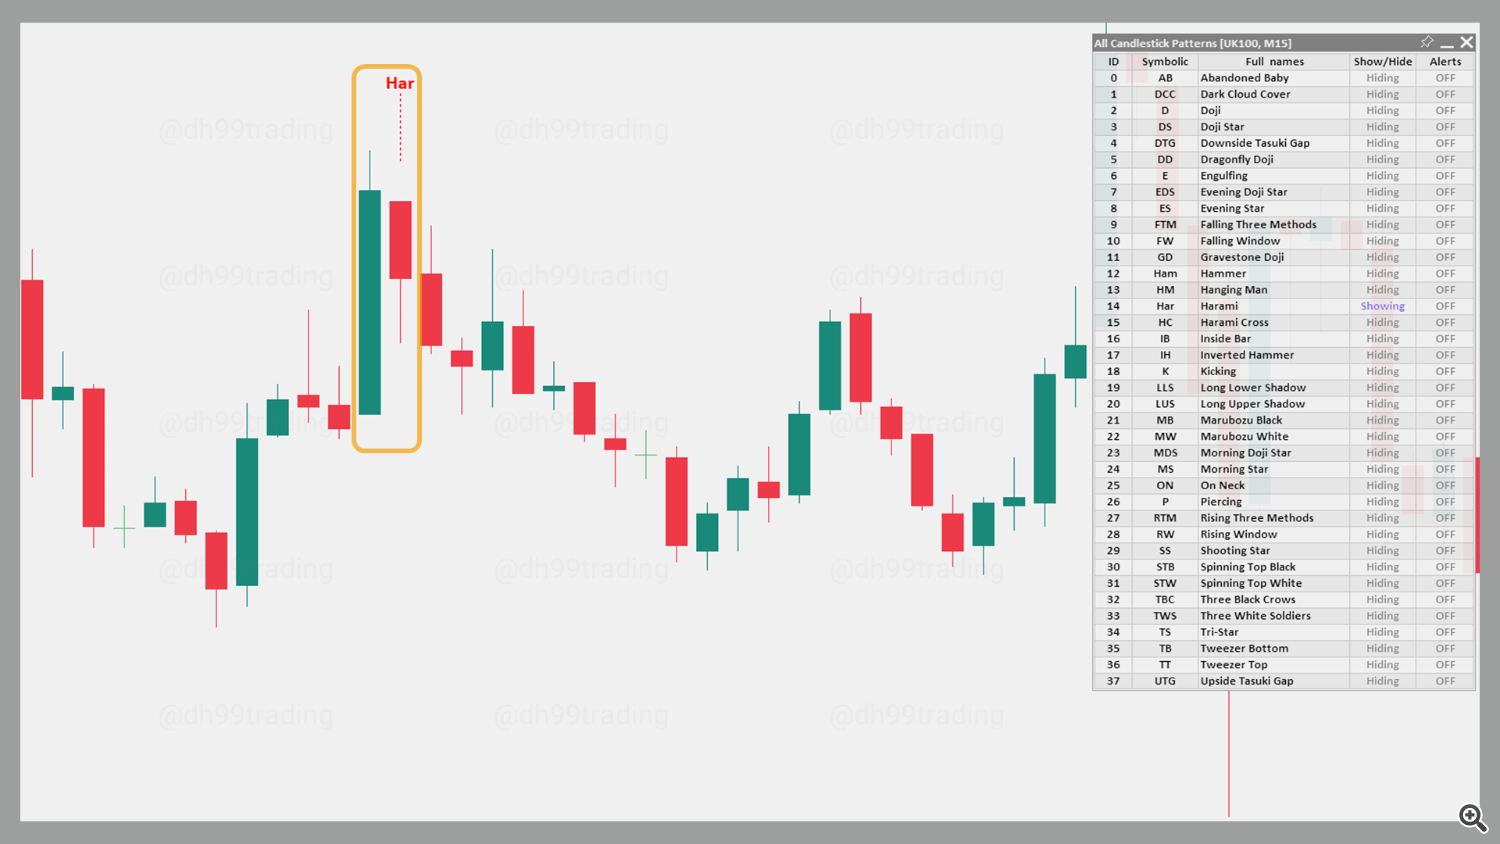
The Bearish Harami is a two-candle pattern that usually appears during an uptrend. The first candle is a long green candle, followed by a smaller red candle that is entirely within the range of the first. This pattern suggests a loss of bullish momentum and hints at a possible bearish reversal.
The bullish counterpart to this pattern is the Bullish Harami pattern.
25. Harami – Bullish
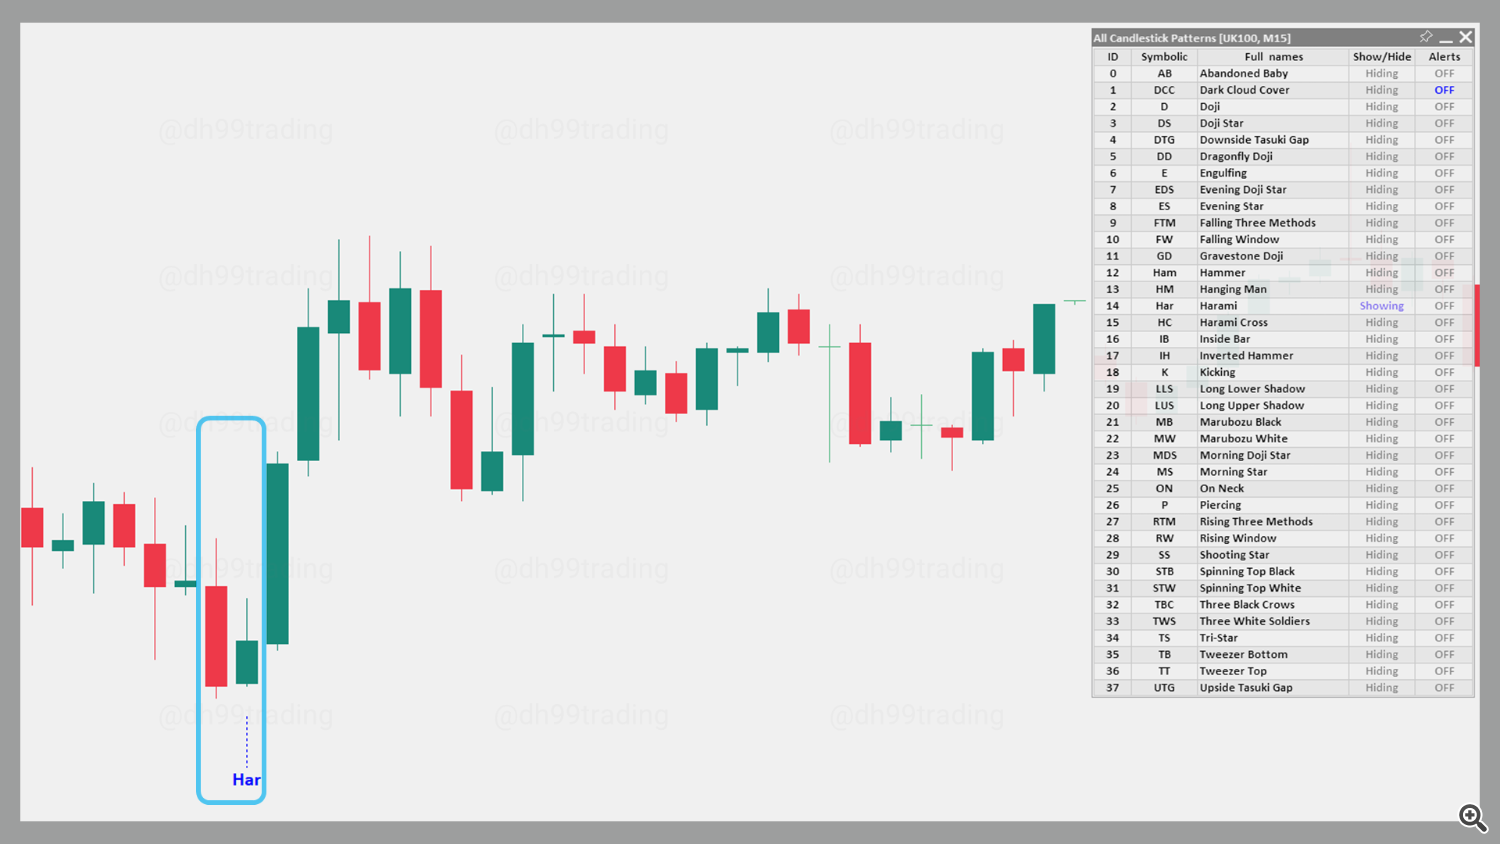
The Bullish Harami is a two-candle reversal pattern found in a downtrend. The first candle is a long red candle, followed by a smaller green candle that is entirely within the range of the first. This pattern suggests a weakening in bearish momentum and hints at a potential bullish reversal.
The bearish counterpart to this pattern is the Bearish Harami pattern.
26. Harami Cross – Bearish
The Bearish Harami Cross is a variation of the Harami pattern that typically appears during an uptrend. It consists of a long green candle followed by a Doji candle that is entirely within the range of the first candle. This pattern indicates strong indecision among buyers and hints at a potential bearish reversal.
The bullish counterpart to this pattern is the Bullish Harami Cross pattern.
27. Harami Cross – Bullish
The Bullish Harami Cross is a variation of the Harami pattern that appears during a downtrend. It consists of a long red candle followed by a Doji candle entirely within the range of the first. This pattern suggests a potential bullish reversal as selling pressure diminishes.
The bearish counterpart to this pattern is the Bearish Harami Cross pattern.
28. Inside Bar – Indecision
The Inside Bar is a candlestick pattern where the current bar’s high is lower than the previous bar’s high, and the current bar’s low is higher than the previous bar’s low. This pattern indicates consolidation and indecision in the market, suggesting a breakout may occur. It can serve as a continuation or reversal pattern, depending on the trend context.
29. Inverted Hammer – Bullish
The Inverted Hammer is a bullish reversal pattern that forms during a downtrend. It has a small body and a long upper shadow, resembling an upside-down hammer. This pattern shows that buyers attempted to push prices higher but met resistance, suggesting a potential reversal if followed by a bullish candle.
The bearish counterpart to this pattern is the Shooting Star pattern.
30. Shooting Star – Bearish
The Shooting Star is a bearish reversal pattern that appears at the top of an uptrend. It has a small body near the low of the candle and a long upper shadow, indicating that buyers initially pushed prices higher but sellers took control, pushing the price back down near the open. This pattern suggests a potential downward reversal.
The bullish counterpart to this pattern is the Inverted Hammer pattern.
31. Kicking – Bearish
A bearish Kicking pattern consists of two candles and indicates a potential reversal toward a downtrend. It starts with a bullish marubozu followed by a bearish marubozu that gaps down, suggesting strong bearish momentum. This pattern signals a possible start of a downtrend if the gap remains unfilled.
The bullish counterpart to this pattern is the Bullish Kicking pattern.
32. Kicking – Bullish
A bullish Kicking pattern consists of two candles and indicates a potential reversal toward an uptrend. It begins with a bearish marubozu followed by a bullish marubozu that gaps up, showing strong bullish sentiment. This pattern signals a possible start of an uptrend if the gap remains unfilled.
The bearish counterpart to this pattern is the Bearish Kicking pattern.
33. Long Lower Shadow – Bullish
The Long Lower Shadow is a bullish candlestick pattern, indicating that sellers initially pushed prices lower but buyers regained control by the close. This pattern suggests a potential upward reversal as the long lower shadow signals buying interest.
The bearish counterpart to this pattern is the Long Upper Shadow pattern.
34. Long Upper Shadow – Bearish
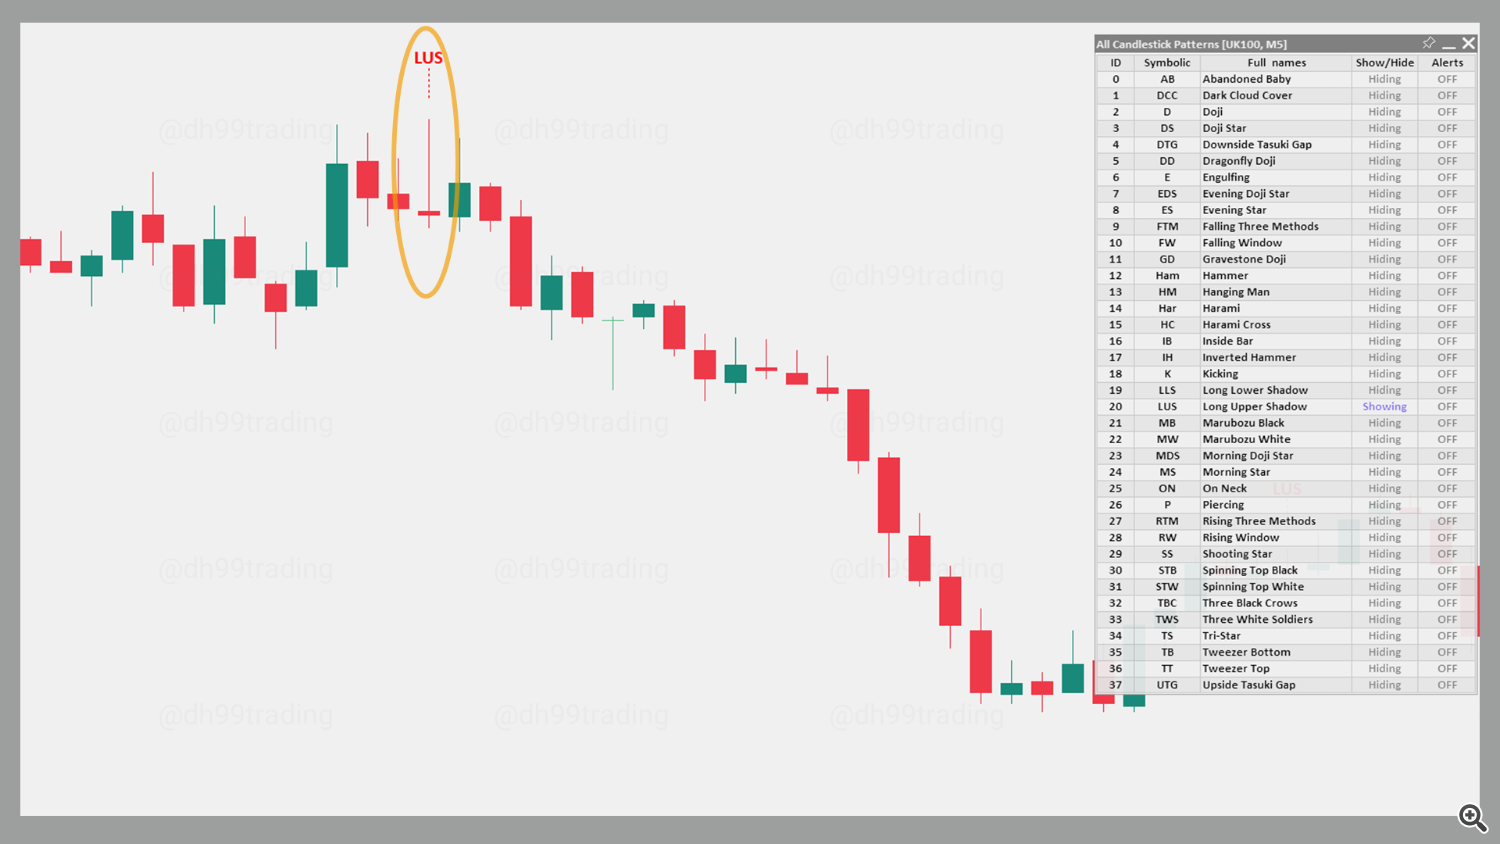
The Long Upper Shadow is a bearish candlestick pattern, indicating that buyers initially pushed prices higher but sellers regained control by the close. This pattern suggests a potential downward reversal as the long upper shadow signals selling interest.
The bullish counterpart to this pattern is the Long Lower Shadow pattern.
35. Marubozu Black – Bearish
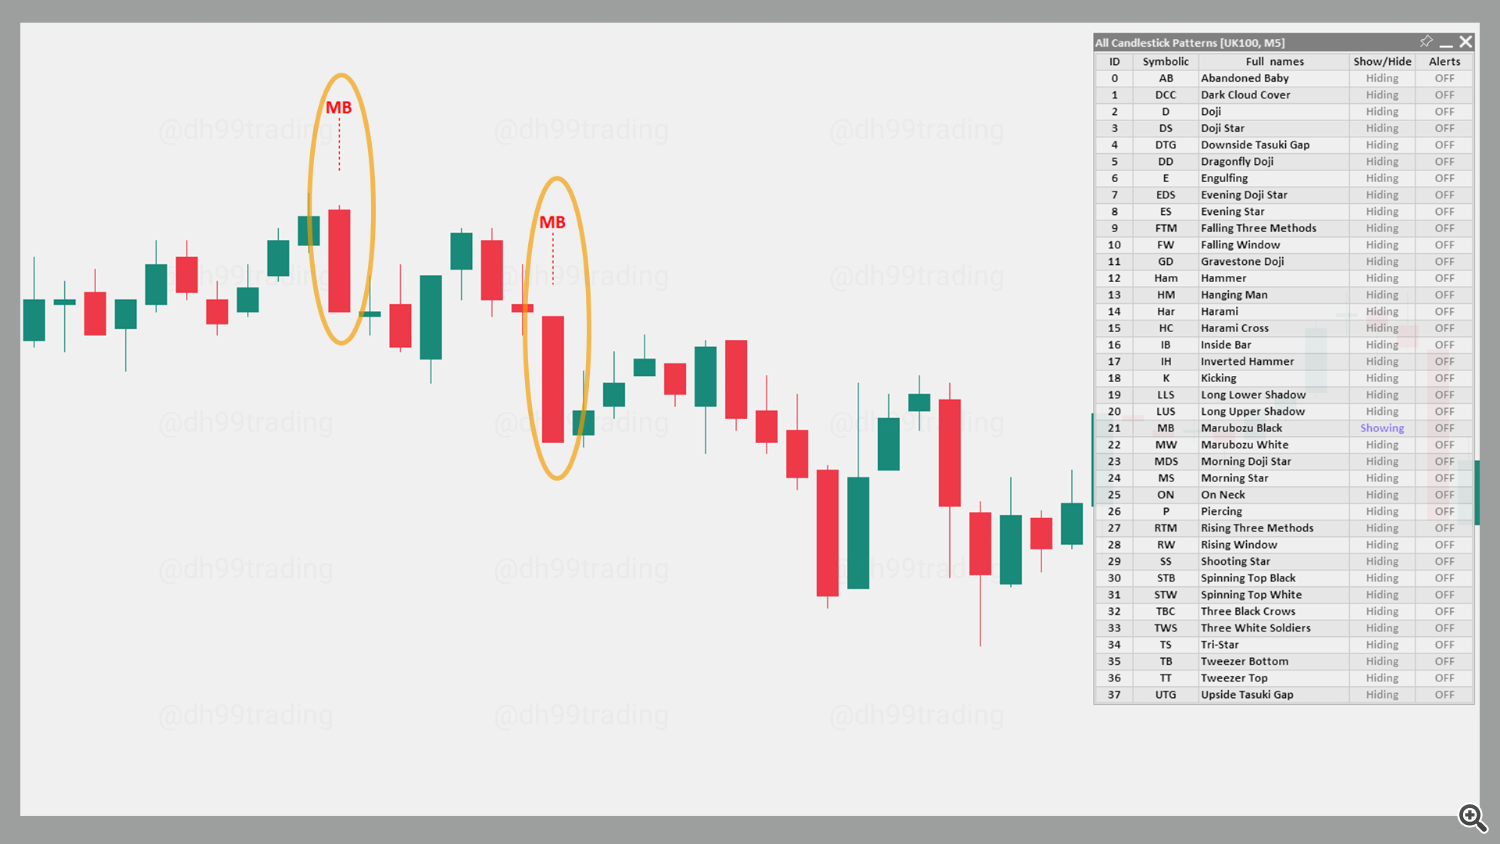
The Marubozu Black is a bearish candlestick with no shadows, indicating strong selling pressure throughout the session. It opens at the high and closes at the low, signaling that sellers were in complete control. This pattern often signals a continuation of a downtrend.
The bullish counterpart to this pattern is the Marubozu White candlestick pattern.
36. Marubozu White – Bullish
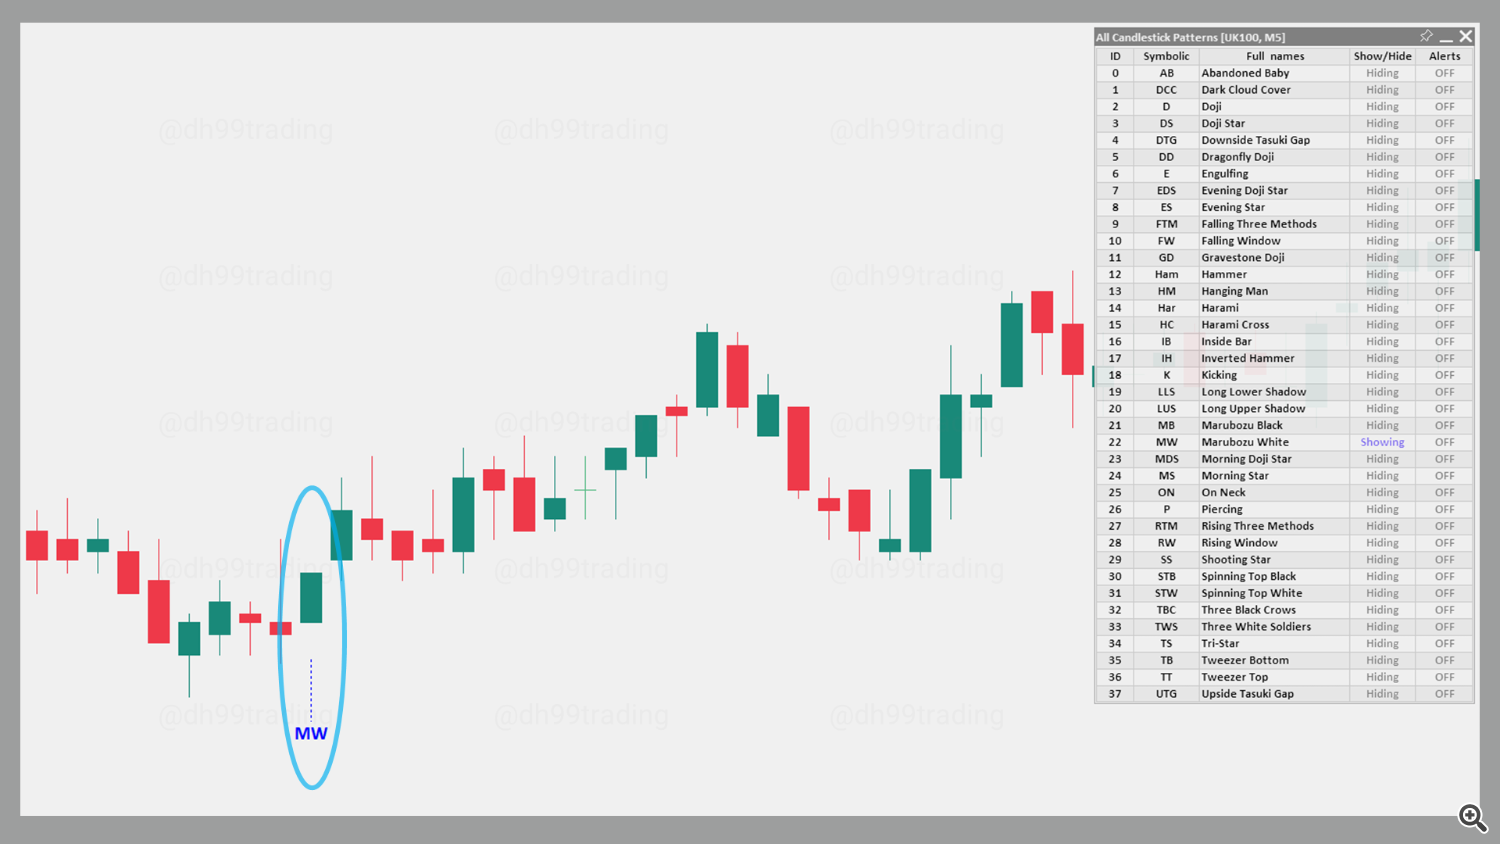
The Marubozu White is a bullish candlestick with no shadows, indicating strong buying pressure throughout the session. It opens at the low and closes at the high, signaling that buyers were in complete control. This pattern often signals a continuation of an uptrend.
The bearish counterpart to this pattern is the Marubozu Black candlestick pattern.
37. On Neck – Bearish
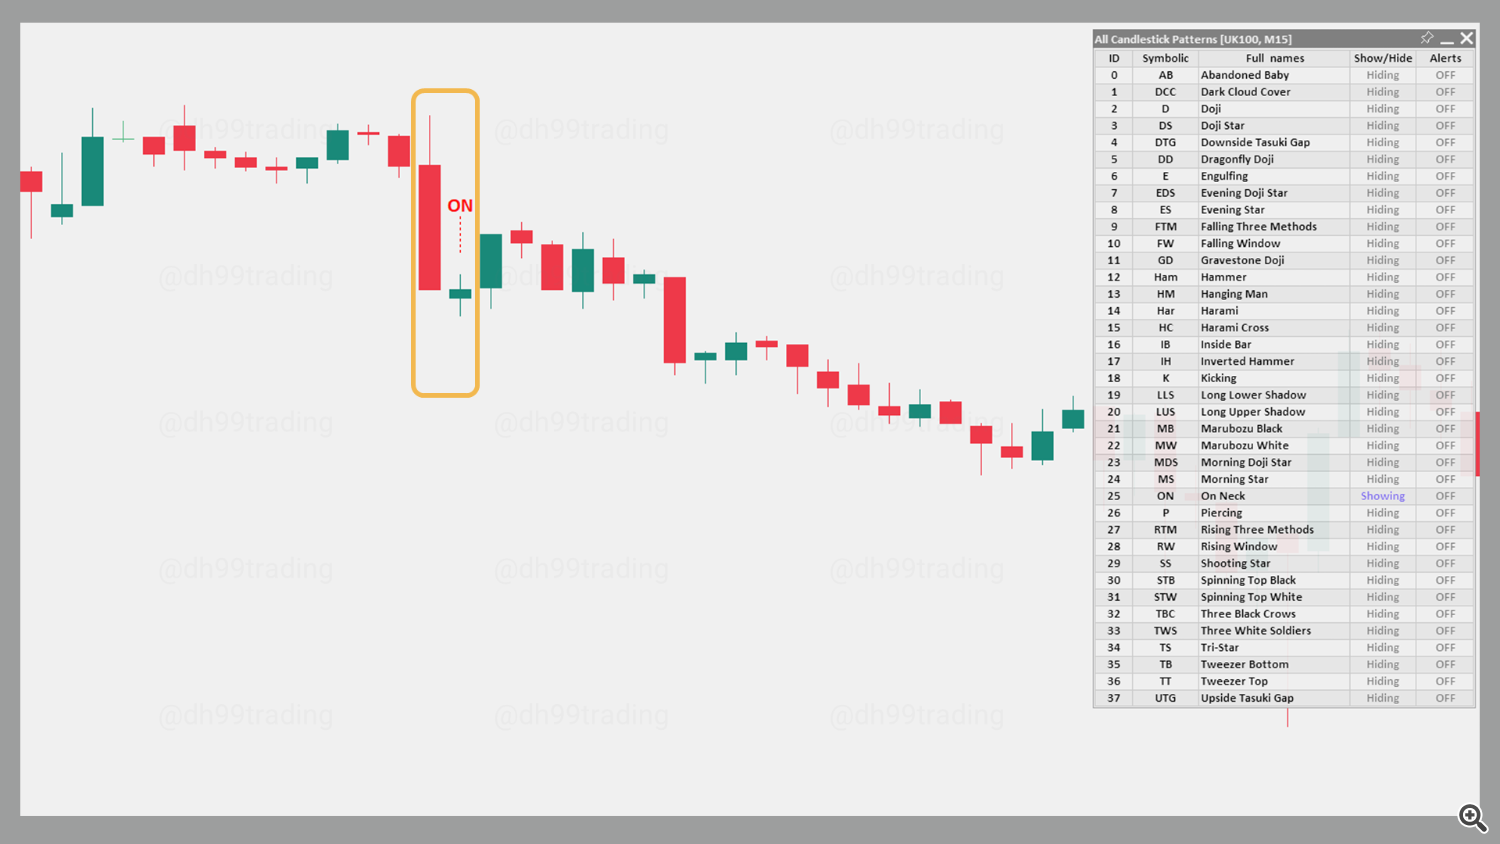
The On Neck is a two-candle bearish continuation pattern found in a downtrend. The first candle is long and red, followed by a smaller green candle. The green candle’s close is near the low of the previous red candle, suggesting the downtrend might continue.
38. Spinning Top Black – Indecision
The Spinning Top Black is a candlestick with a small red body and long shadows, indicating indecision in the market. This pattern often signals a possible pause or reversal, as neither buyers nor sellers have gained control.
The bullish counterpart to this pattern is the Spinning Top White pattern.
39. Spinning Top White – Indecision
The Spinning Top White is a candlestick with a small green body and long shadows, also indicating indecision in the market. This pattern signals potential pause or reversal, showing that neither buyers nor sellers have gained control.
The bearish counterpart to this pattern is the Spinning Top Black pattern.
40. Three Black Crows – Bearish
The Three Black Crows is a bearish reversal pattern that consists of three consecutive long red candles, each opening within the body of the previous candle and closing near the low. This pattern signals strong bearish sentiment and the likelihood of a continued downtrend.
The bullish counterpart to this pattern is the Three White Soldiers pattern.
41. Three White Soldiers – Bullish
The Three White Soldiers is a bullish reversal pattern made up of three consecutive long green candles, each opening within the body of the previous candle and closing near the high. This pattern suggests strong bullish sentiment and the likelihood of a continued uptrend as buyers push prices higher in succession.
The bearish counterpart to this pattern is the Three Black Crows pattern.
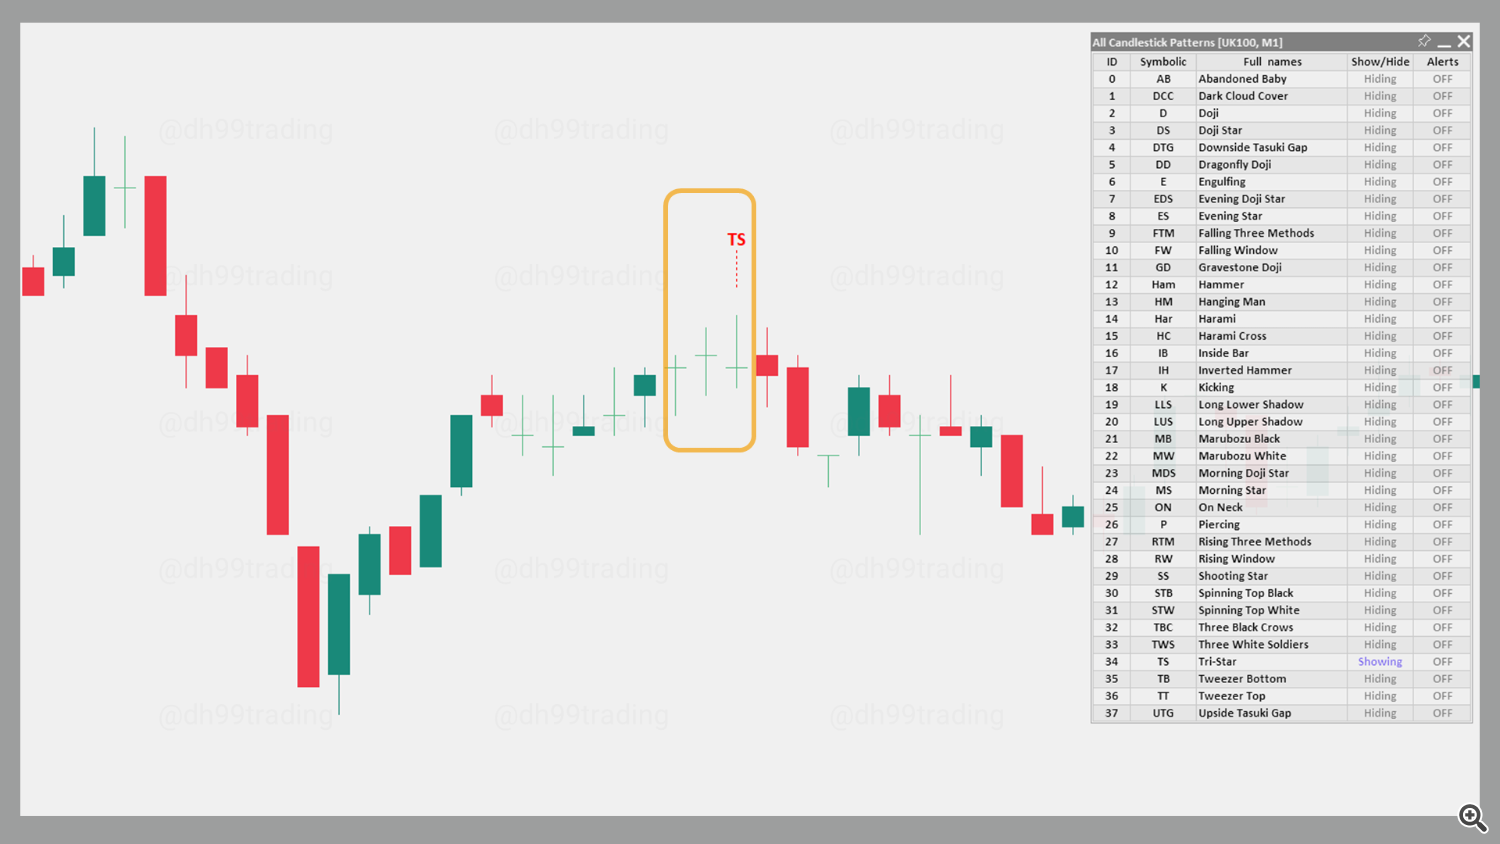
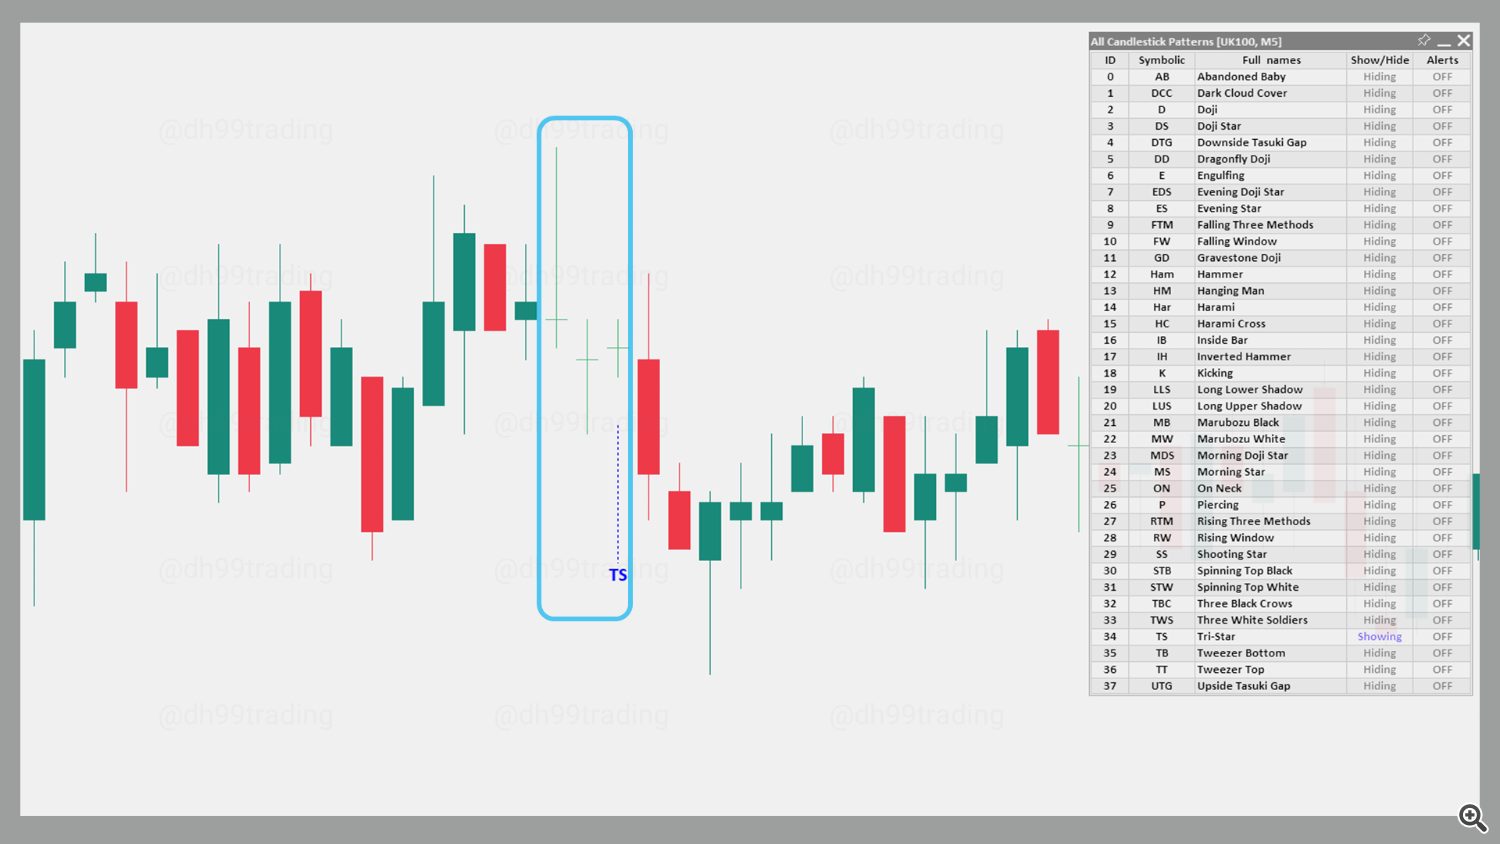
42. Tri Star – Bearish
A bearish Tri Star pattern can form when three consecutive Doji candles appear at the top of an uptrend. The pattern signifies strong indecision followed by a potential reversal, as market sentiment shifts from bullish to bearish.
The bullish counterpart to this pattern is the Bullish Tri Star pattern.
43. Tri Star – Bullish
A bullish Tri Star pattern can form when three consecutive Doji candles materialize at the tail-end of a downtrend. The pattern signifies strong indecision followed by a potential reversal, as market sentiment shifts from bearish to bullish.
The bearish counterpart to this pattern is the Bearish Tri Star pattern.
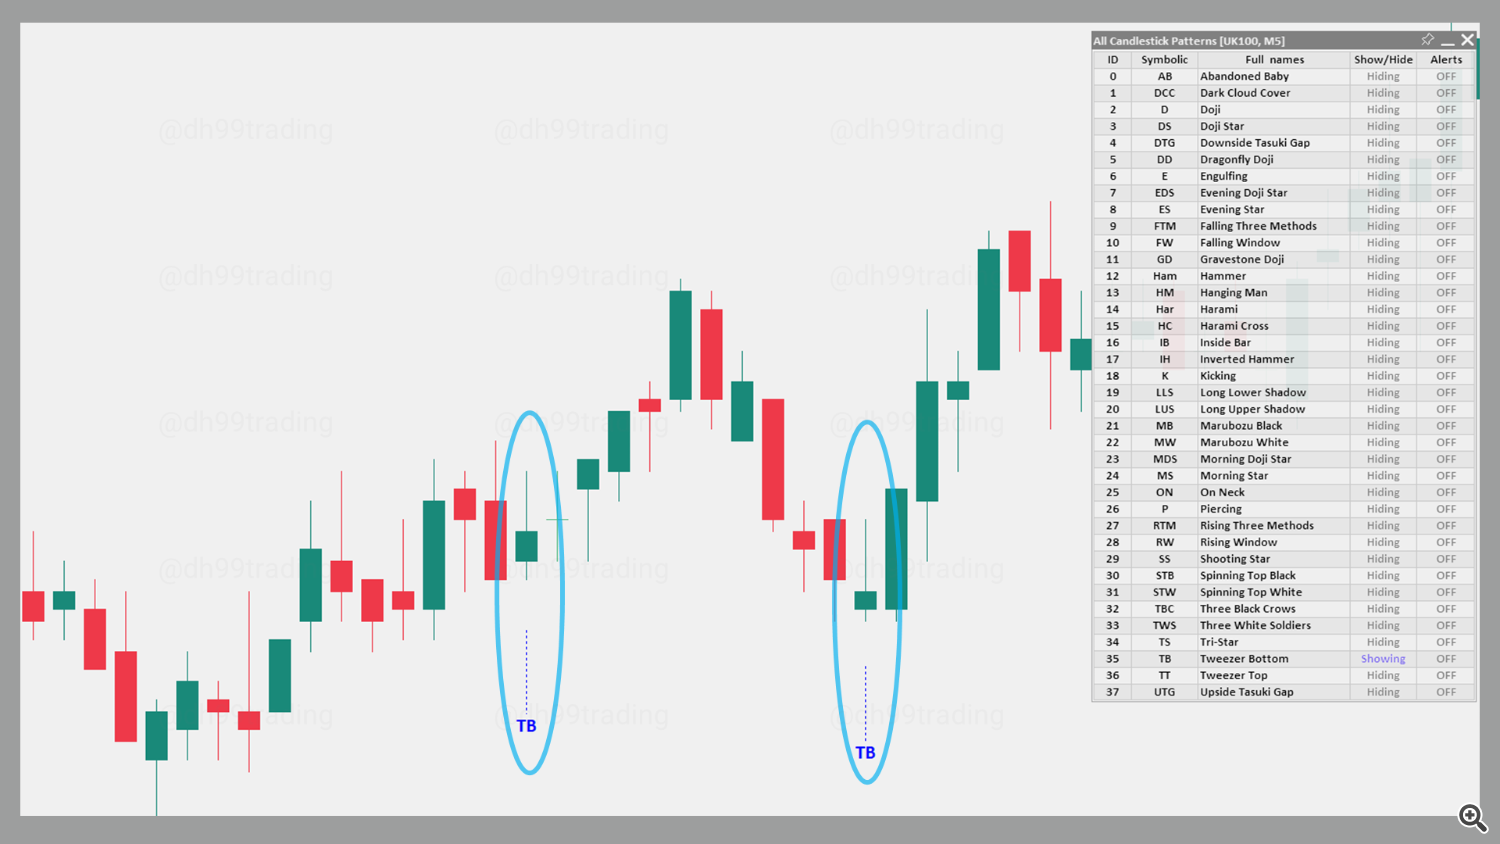
44. Tweezer Bottom – Bullish
The Tweezer Bottom is a two-candle pattern that signifies a potential bullish reversal. The pattern is found during a downtrend. The first candle is long and red, and the second candle is green with a low nearly identical to the low of the previous candle. The similar lows, along with the inverted directions, hint that buyers may be taking over.
The bearish counterpart to this pattern is the Tweezer Top pattern.
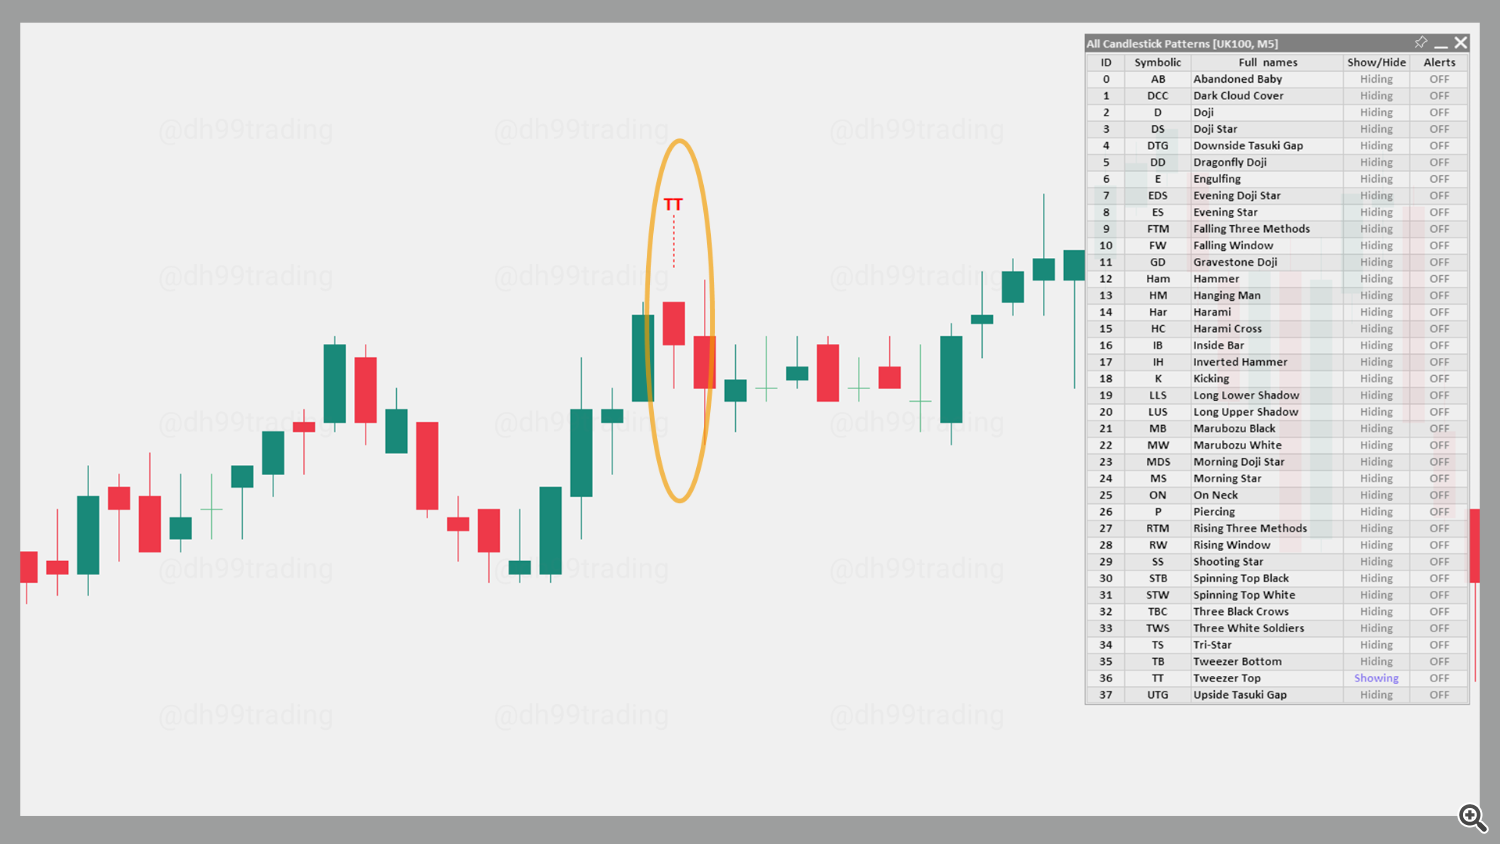
45. Tweezer Top – Bearish
The Tweezer Top is a two-candle pattern that signifies a potential bearish reversal. The pattern is found during an uptrend. The first candle is long and green, and the second candle is red with a high nearly identical to the high of the previous candle. The similar highs, along with the inverted directions, hint that sellers may be gaining control.
The bullish counterpart to this pattern is the Tweezer Bottom pattern.
Candlestick patterns provide invaluable insights into market psychology and potential price movements, helping traders anticipate reversals, continuations, and points of indecision. By mastering these patterns and understanding the nuanced signals they offer, traders can improve their analytical skills and make more informed decisions. Whether a novice or an experienced trader, the application of these patterns, supported by the All Candlestick Patterns indicator, can serve as a powerful asset in navigating complex financial markets. Embrace these tools to enhance your trading strategy and stay ahead in a dynamic market landscape.


