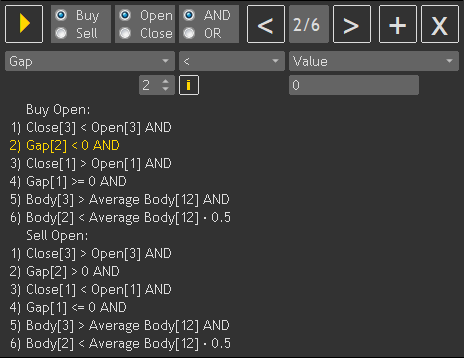
White Soldiers / Black Crows
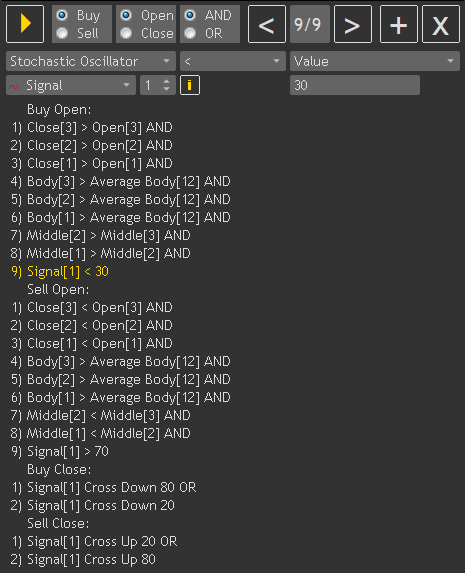
3 consecutive candles in the same direction in a row with a body greater than the average for the last 12 candle bodies.
Buy (White Soldiers): 3 bullish candles, the middle of the last 2 of which is higher than the middle of the previous ones.
Sell (Black Crows): 3 bearish candles, the middle of the last 2 of which is lower than the middle of the previous ones.
For the case without signal confirmation by the indicator, set a trailing stop of 200 points:
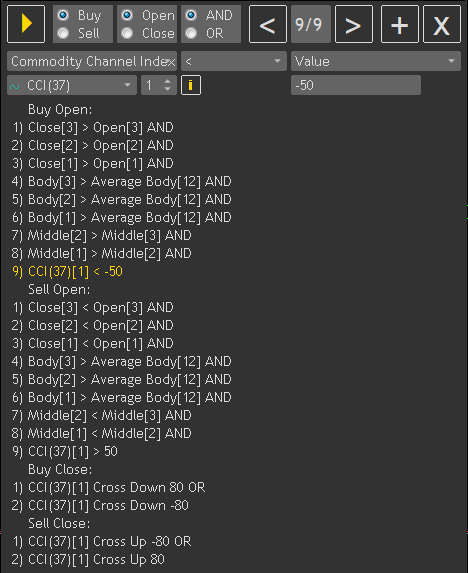
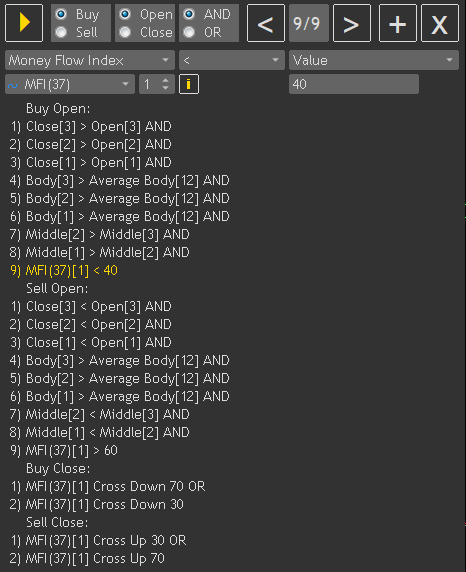
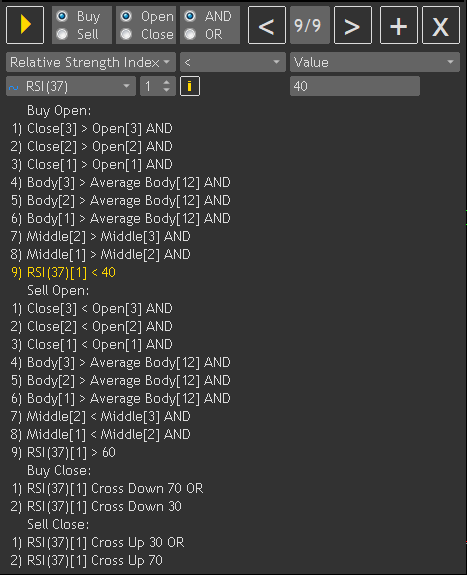
For cases with signal confirmation by indicators, place the needed indicator on the chart and additionally set the opening and closing conditions in accordance with the table in the examples.
Confirmation by CCI:
Confirmation by MFI:
Confirmation by RSI:
Confirmation by Stochastic Oscillator:
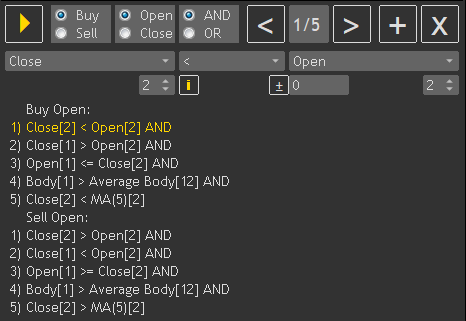
Engulfing
Add MA to the chart to determine the trend: the engulfed candle closed above MA – the trend is up, below – down.
Buy (Bullish Engilfing): the body of the bullish candle completely engulfs the body of the previous bearish one on a downtrend.
Sell (Bearish Engilfing): the body of the bearish candle completely engulfs the body of the previous bullish one on an uptrend.
The body of the engulfing candle is larger than average.
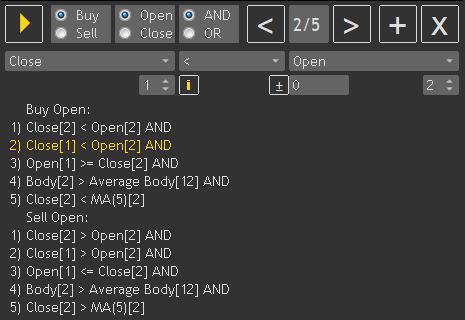
The conditions for confirming signals by the indicator for this and subsequent patterns are the same as the previous one (Engulfing).
Harami
Trend definition – similar to the previous pattern.
Buy (Bullish Harami): the body of the bullish candle is inside the body of the previous bearish one on a downtrend.
Sell (Bearish Harami): the body of the bearish candle is inside the body of the previous bullish one on an uptrend.
The body of the previous candle is larger than average.
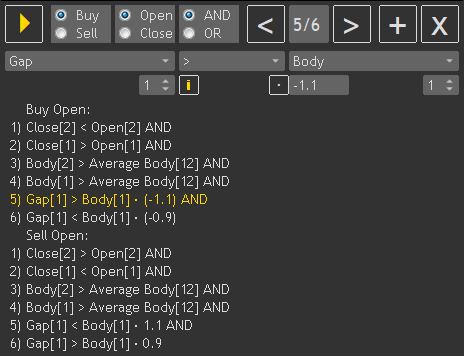
Buy (Bullish Meeting Lines): the bullish candle closes near the close price of the previous bearish one.
Sell (Bearish Meeting Lines): the bearish candle closes near the close price of the previous bullish one.
The bodies of both candles are larger than average. Their closing prices should be approximately at the same level, i.e. the gap between them should differ from the size of the body of the last candle by less than 10%.
Piercing Line / Dark Cloud Cover
Trend definition – similar to the Engulfing pattern.
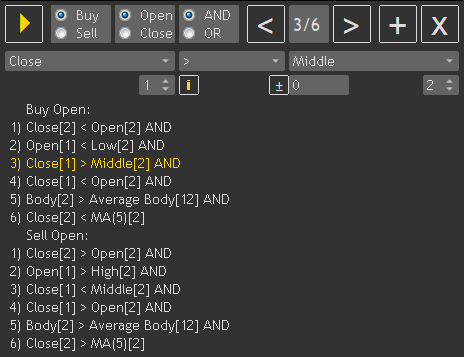
Buy (Piercing Line): a bullish candle opens below the Low of the previous bearish one and closes between the open and the middle of the previous one on a downtrend.
Sell (Dark Cloud Cover): a bearish candle opens above the High of the previous bullish one and closes between the open and the middle of the previous one on an uptrend.
The body of the previous candle is larger than average.
Inverted Hammer / Hanging Man
Trend definition – similar to the Engulfing pattern.
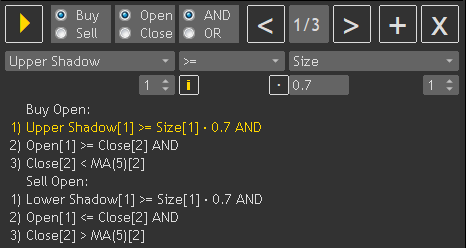
Buy (Inverted Hammer): a candle appears on a downtrend with an upper shadow of at least 70% of the candle size, the opening price of which is not lower than the closing price of the previous one.
Sell (Hanging Man): a candle with a lower shadow of at least 70% of the candle size appears on an uptrend, the opening price of which is not higher than the closing price of the previous one.
Morning Star / Evening Star
Buy (Morning Star): after a long bearish candle, a candle with a small body appears with a gap down, followed by a bullish candle without a gap or with an upward gap.
Sell (Evening Star): after a long bullish candle, a candle with a small body appears with a gap up, followed by a bearish candle without a gap or with a downward gap.
