Where did BD% idea come from?
Classic Standard Deviation (CSD) is one of the oldest volatility measurement indicators used in technical analysis. The technician has used it for a long time. CSD is the square root of the difference between prices and their average. A high reading means that volatility is strong because prices move far away from their average. A low reading means that volatility is low because prices move around their average in a narrow range.
After I used CSD long enough I found that it is a good volatility measurement tool for the current price, but I cannot use it to compare the volatility of one security with another, because CSD calculation is in point, not in percent. This led me to create the Berma Deviation Percent.
BD% Formula.
Bermaui Deviation Percent (BD%) is a volatility index that measures volatility in percentage rather than points. The idea of BD% is to make an index depending on Classic Standard Deviation (CSD) that moves between 0 and 100 percent. This can be explained in the next steps:
1. Calculate Classic Standard Deviation (CSD) for X number of days.
2. Find the Highest High of the CSD in the same X number of days (= HHV (CSD)).
3. Find the Lowest Low of the CSD in the same X number of days (= LLV (CSD)).
4. Calculate the difference between the Highest High of the CSD & the CSD itself. Let’s call it “the Change” (= HHV(CSD) – CSD).
5. Calculate the difference between Highest High of the CSD & Lowest low of the CSD. Let’s call it “the Range” (= HHV(CSD) – LLV(CSD)).
6. Now, divide “the Change” over “the Range” and multiply the result by 100.
So, the Berma Deviation Percent formula is:
BD% = 100 x (= HHV(CSD) – CSD) / (= HHV(CSD) – LLV(CSD))
Therefore, BD% is a William R% Oscillator calculated on Classic Standard Deviation. Some people ask me why I calculate BD% like this & why I did not invert the calculation method. That is because I use BD% in the calculation of another important indicator called the “Berma Bands”.
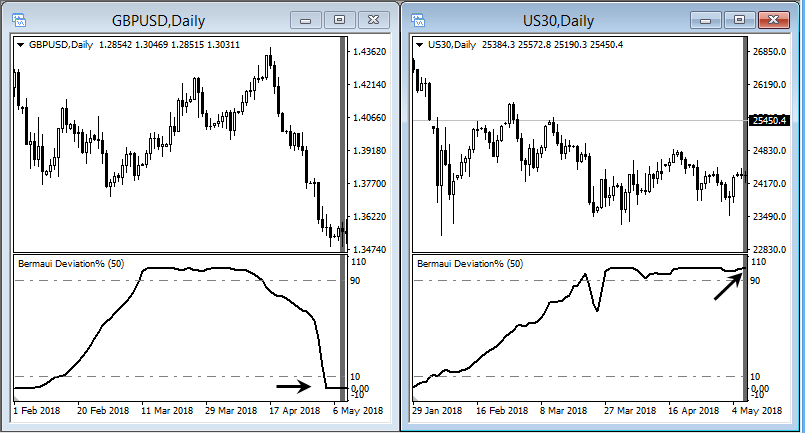
Measuring volatility as percentage rather than in points can be very useful in technical analysis. BD% helps technicians to compare the volatility of one security with the other. As an example at 08/05/2018, the Dow Jones Industrial standard deviation read $400.15 while GBPUSD standard deviation of the same day read $0.212. If you show these numbers to anyone, he will tell you that the Dow Jones Industrial is more volatile than GBPUSD, while the opposite is the right answer, because the Dow Jones Industrial was in a sideways movement and GBPUSD was in a steep downtrend as you can see from the next charts.
If you look at the same chart depending on BD% you will see that the Dow Jones Industrial reads 100% which means that volatility is very low while GBPUSD reads 0% which means that volatility is very high (remember that BD% is an inverted scale where 100% is the lowest and 0% is the highest).

That is one reason why BD% can be a good technical analysis tool.
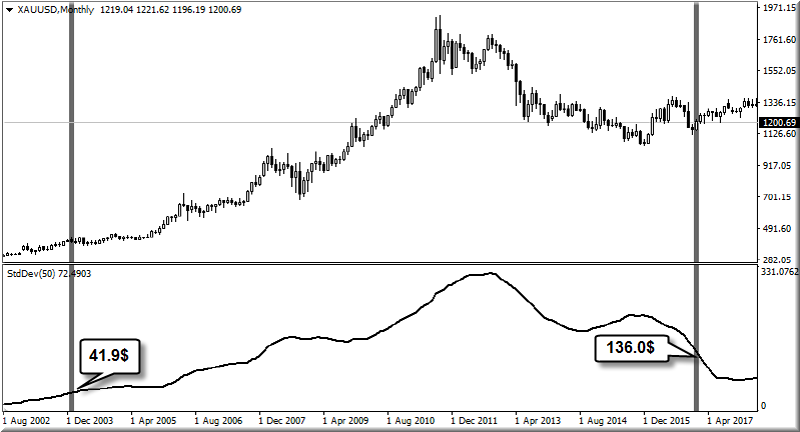
In addition, BD% helps compare the volatility of the same security in different periods. As an example, the 50-bar period standard deviation of Gold on the monthly chart in January 2004 was $41.9, while it read $136 in January 2017. If you show the numbers to anyone, he will tell you that Gold in 2017 is more volatile than what it used to be in 2004, while the opposite is the right answer.

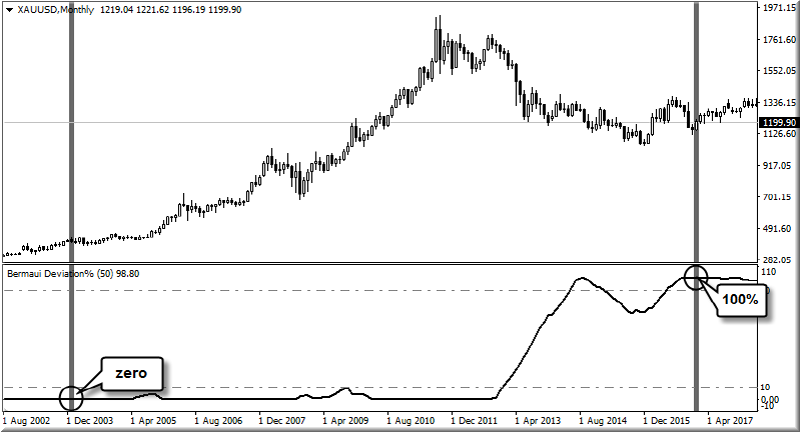
If you look at the same chart depending on BD% you will see that the chart of the gold reads 100% in January 2017 which means that volatility is very low while it reads 0% at January 2004 which means that volatility was very high.

As you can see, relative technical indicators can be very useful giving traders a great advantage when analyzing the market.
I hope you enjoyed this blog
Best regards


