1. Introduction
Emerald EA Builder, as the name states, is an EA Builder (Expert Advisor Builder) that provides a wide set of indicator and price action signals so you can quickly develop your own strategies for Forex, Stocks, Futures, and any other market you wish.
Tired of buying scam EAs in the market? Just easily create your own strategy with a single Expert Advisor.
By combining the more of 20 available indicators and 10 price action signals, including the possibility to add your own custom indicators, Emerald EA Builder allows the user to create an inifinity of strategies. That is, the EA is helpful for people who don’t code, in a sense that you don’t need to know MQL5 to create strategies around the built-in or custom indicators. At the same point, the EA is helpful for coders, because it simplifies the process, so you don’t need to code a thousand of EAs everytime you build a new strategy.
The main goal is to provide a quick, safe and easy to use Expert Advisor. That’s why a 4-year optimization period should normally take around a few minutes to complete (1 minute OHLC or Open Prices modelling) in a 8-core CPU.
This is the weekly update notes that come into the EA.
2. Week updates
This week, we jumped from the version 1.0 to 1.3!
Among performance updates (the EA is even faster…) and bug fixes (… and safer!), some new signals were added this week. Let’s know a bit more about them:
- Outside bar: an Outside Bar occurs when a new bar is formed and its high is higher than the previous high, but also its low is higher than the previous low;
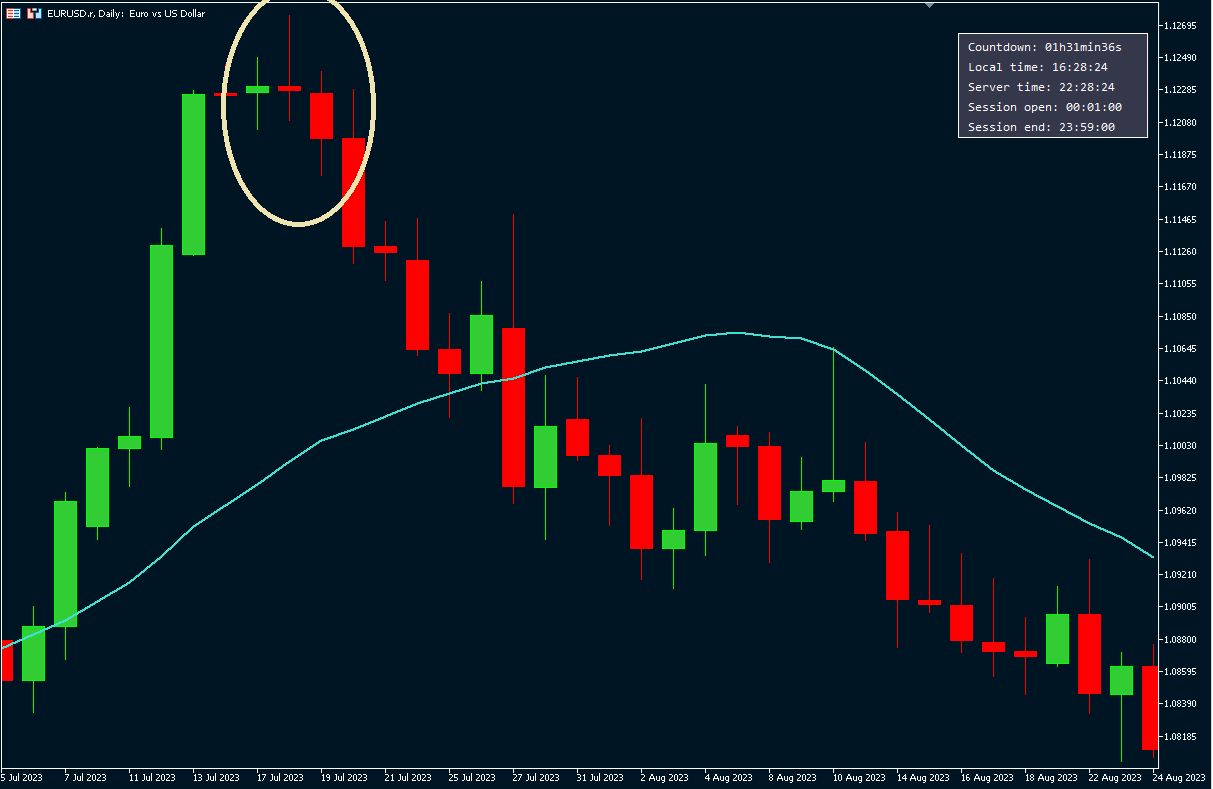
- 123 buy/sell: an 123 is 3-candles price action pattern that occurs for a long signal when the middle bar has its low below the first and the third bars lows and also its high is lower than the first and third bar highs; a short signal happens when the middle bar has its high above the first and the third bar highs and also its low is higher than the first and the third bar lows;
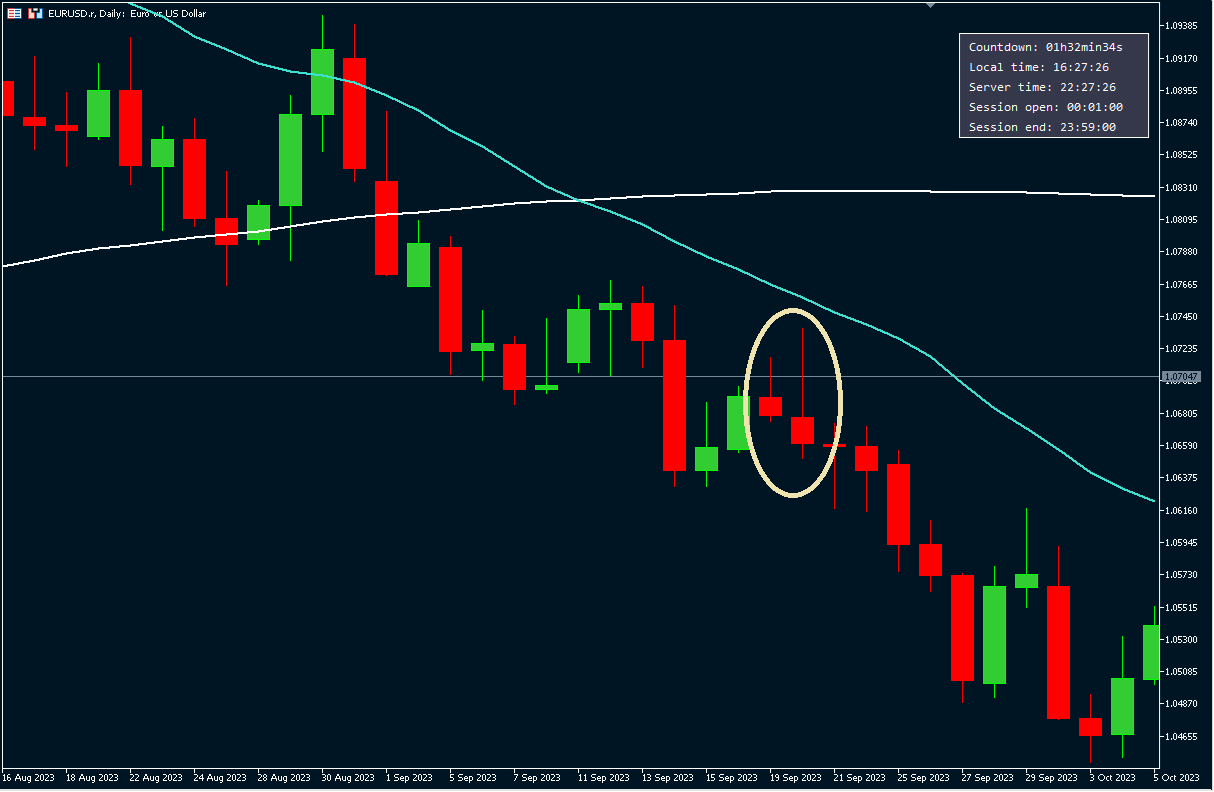
- Ignored bar: an Ignored Bar is a 3-candle pattern that occurs for a long signal when the middle bar is a bearish candle, but its low is higher than the third bar low. Also, the first bar must close above the middle bar high; a short signal happens when the middle bar is a bullish candle, but its high is lower than the third bar high. Also, the first bar must close below the middle bar low.
We also added the Rate of Change (ROC) indicator. ROC represents how much change the price had in a time window. Let’s say the current price is 1. If it closes at 1.10 in the next day, the RoC would be 10% for 1-period. If the day after it would close at 1.20, the RoC would be 20% for 2-periods, and so on. This indicator is good to avoid entering in positions when the price has already moved too much.
More patterns parameters were also added. For example, you can customize how a doji is defined (by default, it is a doji bar if the open and the close prices of a candle are in between 33% and 66% of the candle amplitude) or a hammer candle (by default, a buy hammer occurs when the lowest of the close and the open prices are above 75% of the candle amplitude, whilst the highest of the close and the open prices must be above 90% of the candle amplitude; an inverted hammer, or sell hammer, occurs the other way around).
Take a look on some of the newest added patterns:
Example of an Ignored Bar for a long position:
Outside bar example:

123-sell example:


