FTSE 100, DAX 40, S&P 500 Analysis and Charts
FTSE 100 slips to near one-month low
The FTSE 100 continues its short-term bearish run and is fast approaching the 8,200 late April high, in the process trading in near one-month lows. Further, more significant, support can be spotted in the 8,095 to 8,017 region, made up of the early and mid-April highs and early May low.
Resistance sits at Tuesday’s 8,345 high.
FTSE 100 Daily Chart
Recommended by Axel Rudolph
Get Your Free Equities Forecast
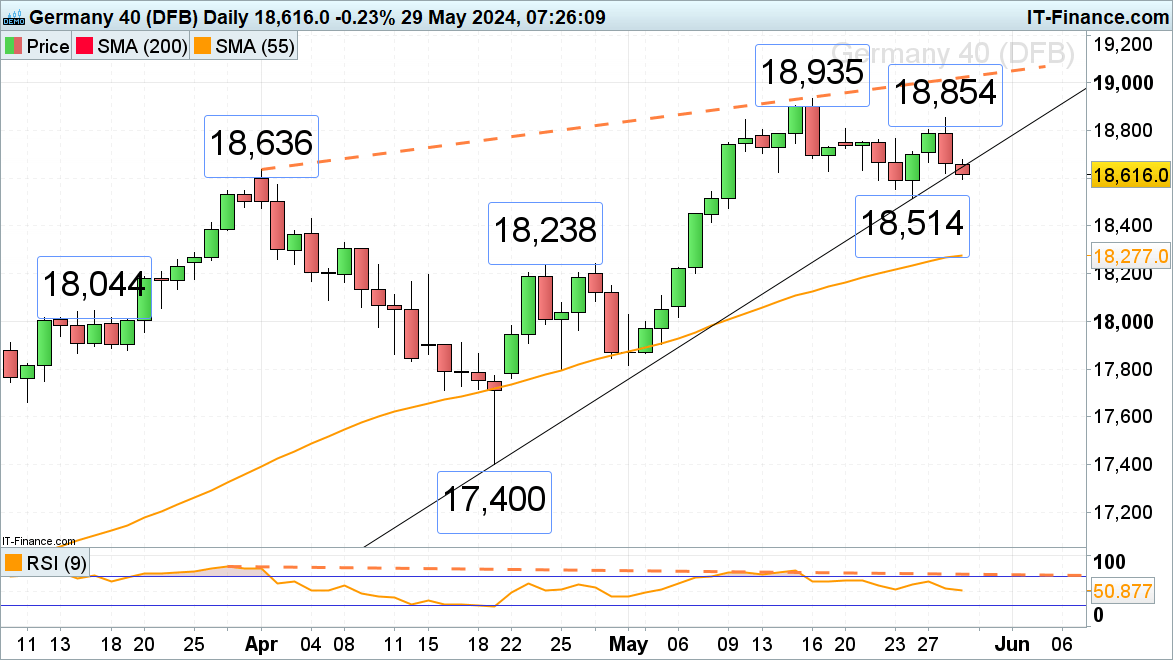
DAX 40 falls through a tentative uptrend line
The DAX 40 keeled over on Tuesday and fell from its 18,854 intraday high to 18,619, a level which is being retested. Below it last week’s low at 18,514 may offer support. If not, the way would be opened for a slide to the 18,238 late April high to unfold.
Short-term downside pressure should remain in play while Tuesday’s high at 18,854 caps.
| Change in | Longs | Shorts | OI |
| Daily | 2% | -7% | -5% |
| Weekly | -10% | -3% | -5% |
DAX 40 Daily Chart
S&P 500 remains short-term under pressure
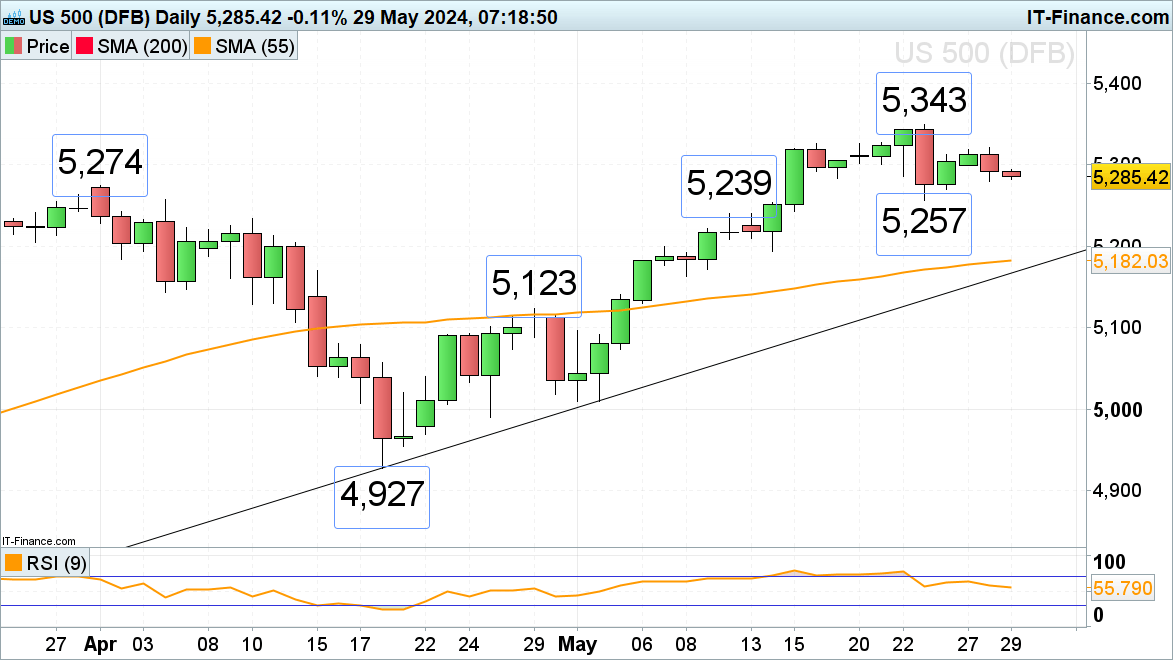
Last week the S&P 500 swiftly came off its record high at 5,343 and slid by over a percent to 5,257 as strong US flash PMI data increased expectations that interest rates will remain higher for longer, leading investors to shy away from risky assets. A fall through Tuesday’s low at 5,281 would put the 5,257 low back on the plate. The risk of this level being revisited remains in play while Tuesday’s high at 5,321 isn’t bettered.
A fall through Thursday’s low at 5,257 would put the 10 May high at 5,239 on the map, below that lies the mid-May low at 5,194.


