When will Meta report its latest earnings?
Meta is scheduled to report its second quarter (Q2) earnings after the market closes on Wednesday, July 31st, 2024.
What should traders look out for?
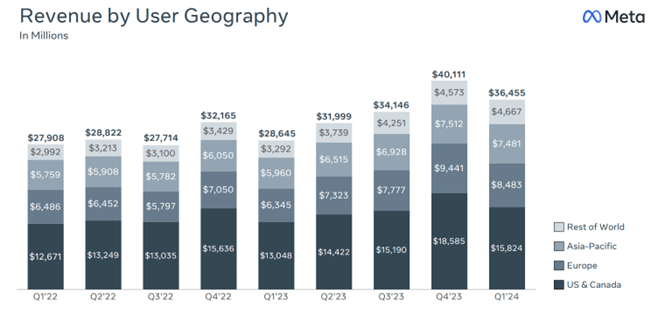
Last quarter, Meta reported a revenue beat of $36.46 billion vs. $36.16 billion expected and an EPS beat of $4.71 per share vs. $4.32 expected.
The company reported the following key numbers.
- Family daily active people (DAP) – DAP was 3.24 billion on average for March 2024, an increase of 7% year-over-year.
- Ad impressions – Ad impressions delivered across Family of Apps increased by 20% year over year.
- Average price per ad increased by 6% year over year.
- Headcount fell to 69,329 as of March, a 10% decrease year over year.
Meta founder and CEO Mark Zuckerberg noted the strong start to the year and said, “The new version of Meta AI with Llama 3 is another step towards building the world’s leading AI. We’re seeing healthy growth across our apps and we continue making steady progress building the metaverse as well.”
Nonetheless, Meta’s Q1 2024 earnings report met with a cool reception. Its share price dived 16% in after-hours trading as investors focused on its Q2 2024 sales forecasts, at the lower end of analysts’ estimates and after it said it expects its 2024 capital expenses to be higher than anticipated due to its investments in AI.
Chart – Family Daily Active People (DAP) in billions
Source Meta
Meta Earnings – What to Expect
During its Q1 Earnings report, Meta said it expected Q2 2024 revenues to be between $36.5 billion to $39 billion. The midpoint of the range, $37.75 billion, would represent 18% year-over-year growth and is just below analysts’ average estimate of$38.3 billion.
The company also said that it expected total expenses in 2024 to be $96-99 billion – more than previously forecasted due to higher infrastructure and legal costs. Full-year 2024 capital expenses are expected to be in the range of $35-$40 billion, up from the prior range of $30-$37 billion as the company continues to “accelerate our infrastructure investments to support our artificial intelligence roadmap.”
Recommended by IG
Get Your Free Equities Forecast
Key Financials – Summary
Revenue: $38.29 bn vs $36.46bn in Q1 2024
EPS: $4.70 vs $4.71c in Q1 2024
Chart – Meta Sales Revenue by User Geography
Source Trading Economics
What else to watch for?
Advertising Performance – Advertising revenues increased by 27% in Q1. The market will look for a similar performance in Q2 2024.
User Engagement Metrics – DAP reached 3.24 billion on average in March 2024, a gain of 7% year over year. Investors will be looking for continued growth in this area.
AI integration and impact – Meta emphasised AI integration in its products, contributing to strong financial results in Q1.Look for updates on how AI is improving user engagement, particularly in areas like Reels, where AI-powered recommendations have led to an 8-10% increase in watch time.
Expenses and profitability – Meta increased its capital expenditure outlook for 2024 to between $35 billion and $40 billion.Watch for any further increases to expense projections and their impact on profitability.
Reality Labs performance – Reality Labs includes virtual, augmented, and mixed reality related consumer hardware, software and content used in developing the MetaVerse. Analysts expect the division to show an operating loss of $4.31 billion for the quarter as it continues to bleed cash.
Forward guidance—Investors will look for guidance on Meta’s outlook for Q3 and the rest of 2024, as this will provide insights into the company’s expectations for growth and challenges in the coming months.
Meta Shares Technical Analysis
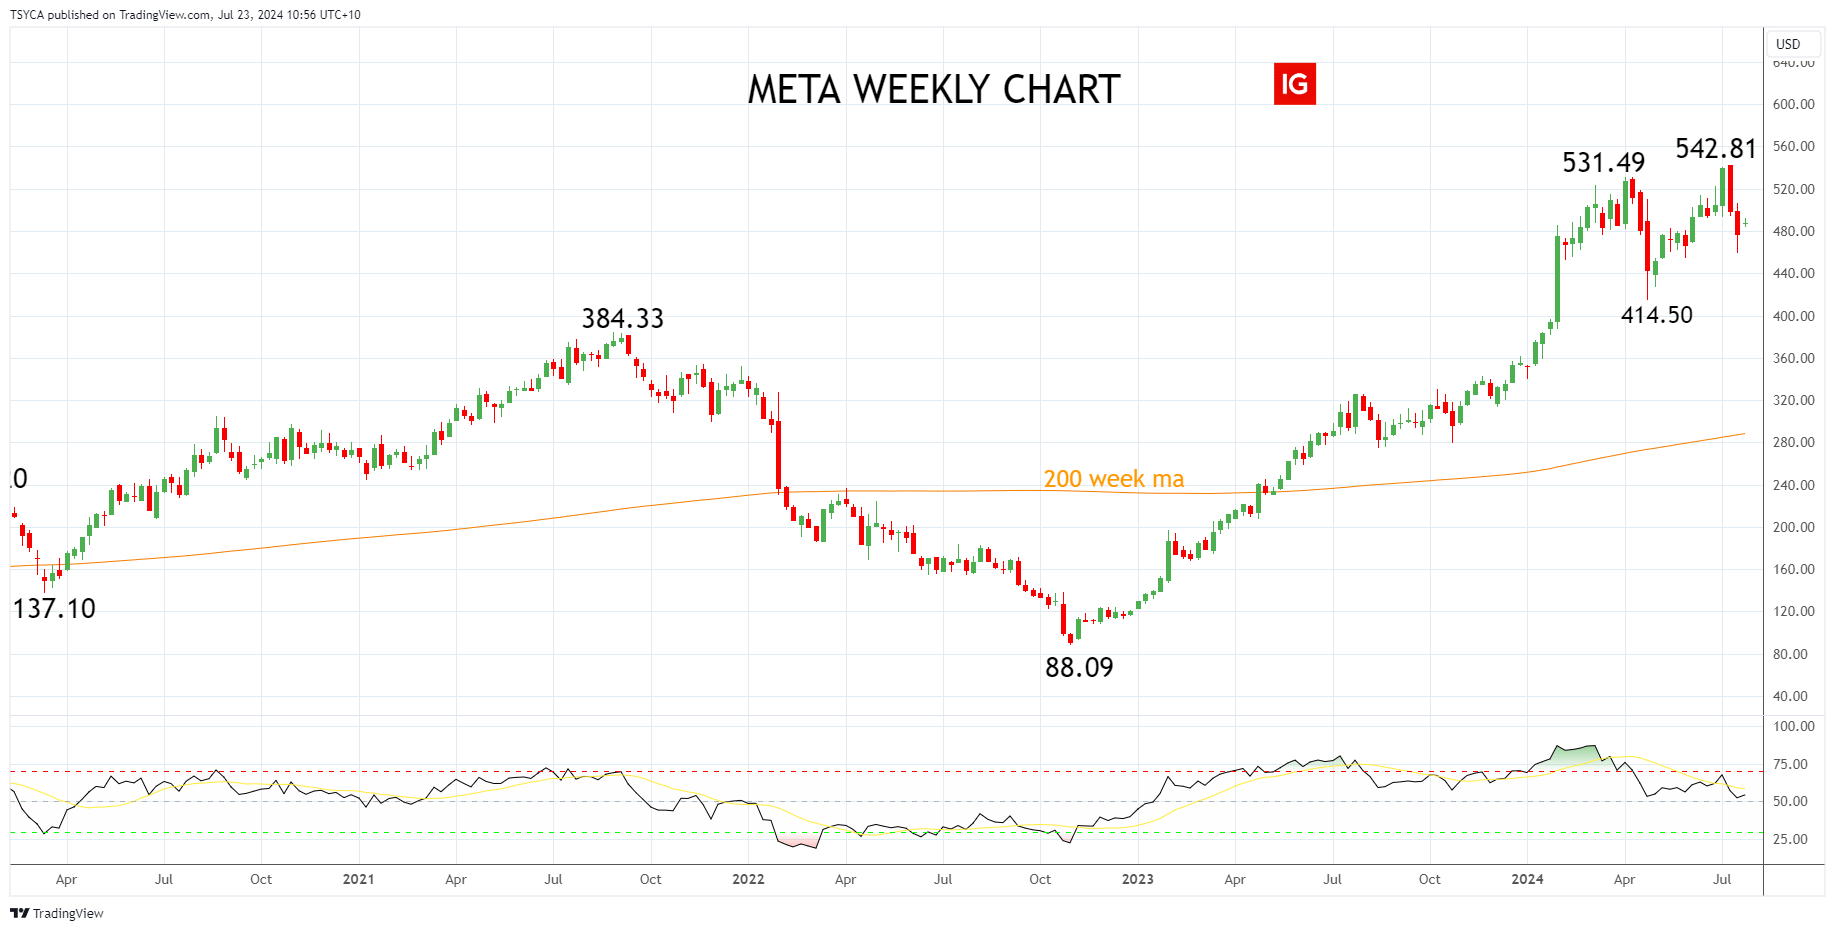
Meta’s share price soared 194% in 2023, reclaiming all and more of the losses it suffered in 2022 after hitting a low of $88.09.
Meta has extended its gains in 2024, reaching a fresh record high of $542.81 in early July. Notably, the high was made on selling, with the Meta share price falling 15% in the following two weeks.
Meta Weekly Chart
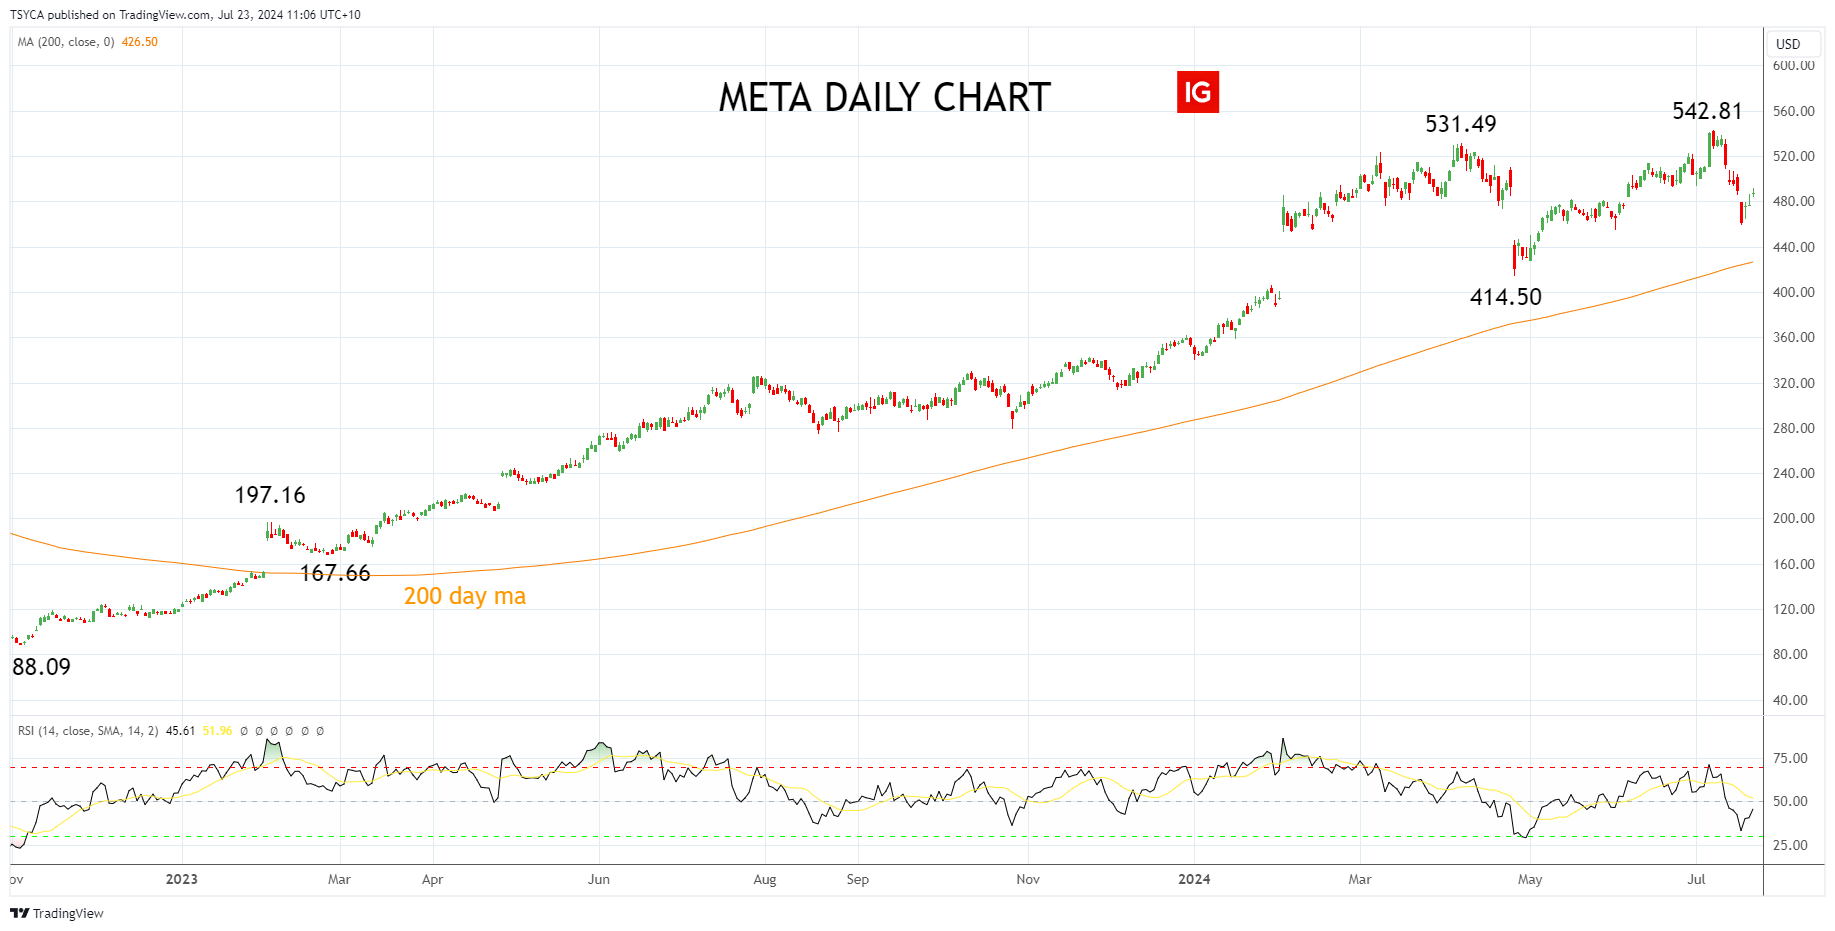
Turning to the daily chart, while Meta’s share price has been able to ride the AI tech frenzy higher in 2024, we note the bearish divergence that occurred at the early July $542.81 high, evident via the RSI indicator.
Bearish divergence and the possibility of a completed five-wave Elliott Wave advance from the $88.09 low to the $542.81 high indicate that Meta’s share price may have already entered a correction.
This could see Meta’s share price test support in the $426/$414.50 area, which includes the 200-day moving average and the April $414.50 low. Buyers would be expected to be operating in this support region, in anticipation of the uptrend resuming.
Meta Daily Chart
Summary
Meta is scheduled to report its second quarter (Q2) earnings after the market closes on Wednesday, July 31st, 2024. While expectations are high, the technical picture suggests that the Meta share price may have entered a correction which may offer better buying levels before the uptrend resumes.
Source Tradingview. The figures stated are as of July 22nd, 2024. Past performance is not a reliable indicator of future performance. This report does not contain and is not to be taken as containing any financial product advice or financial product recommendation.


