Quantitative Analysis of Dynamic Fibo Scalper: Comparing Returns with Fibonacci Levels and Monte Carlo Simulations
In our previous post, we explored the key features, general settings, and functionality of the “Dynamic Fibo Scalper EA,” providing examples of live trades on US30 and Nasdaq. Now, we’ll dive into an in-depth quantitative analysis, sharing the results of 5 years of backtesting . We’ll compare two strategies based on the same Fibonacci levels and determine which approach works best for us…
The first strategy (A) involves:
- Buy_Level4: Buying after a breakout above Level 4 (61.8%).
- Sell_Level2: Selling after a breakdown below Level 2 (38.2%).
The second strategy (B) is simply the reverse of strategy A:
- Buy_Level2: Buying after a breakout above Level 2 (38.2%).
- Sell_Level4: Selling after a breakdown below Level 4 (61.8%).
In this post, we will present the backtesting results and analysis for the Nasdaq (US100) using the M5 time frame. This is the parameters utilized for the analysis.

Performance Metrics :
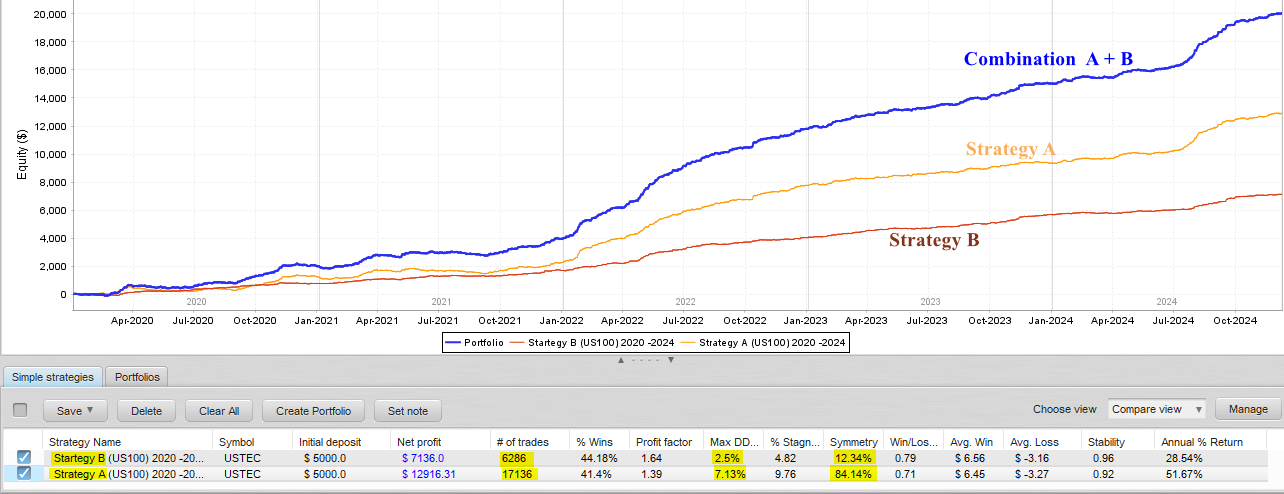
- Strategy A significantly outperforms Strategy B in terms of net profit.
- Strategy A executes more than twice the number of trades compared to Strategy B.
- Strategy B has a slightly higher win rate than Strategy A.
- Strategy B has a better profit factor, indicating that its winning trades are more profitable relative to its losing trades.
- Strategy B has a significantly lower drawdown, making it less risky compared to Strategy A.
- Strategy A demonstrates a balance between long and short trades, whereas Strategy B shows a preference for more long orders than short ones.
- Strategy A delivers a much higher annual return compared to Strategy B
- Strategy B is slightly more stable than Strategy A, reflecting more consistent performance.
Equity Curve Analysis :
- Strategy A demonstrates a steeper and more consistent growth in equity over time, reflecting its higher profitability.
- Strategy A is more aggressive, achieving higher profits and annual returns but at the cost of increased drawdown and lower stability.
- Strategy B, while showing slower growth, maintains a smoother curve with less fluctuation, aligning with its lower drawdown and higher stability.
- Strategy B is more conservative, with lower profits and returns but better risk management and consistency.
Monthly Performance :

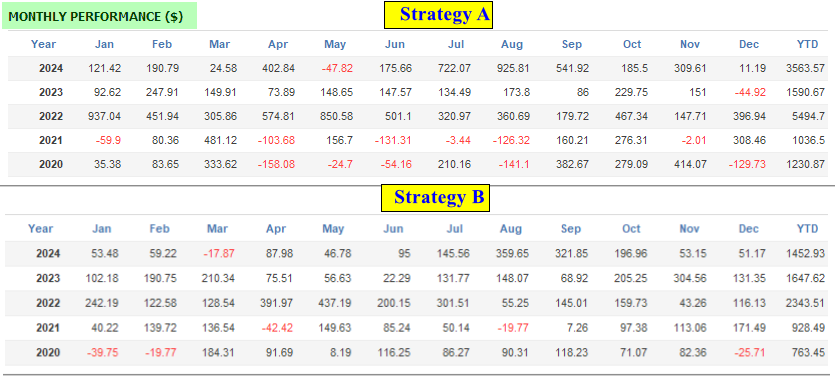
- Strategy A exhibits more negative monthly performances compared to Strategy B. However, both strategies demonstrate strong recovery and impressive performance in later years, particularly in 2022, 2023, and 2024, with consistent positive returns.
Monte Carlo Simulations : Best and Worst Scenarios
Monte Carlo analysis is a powerful technique used to estimate the risk and profitability of trading strategies with greater realism. By running multiple simulations with small random variations, it helps evaluate the robustness of a strategy, predict expected profit and drawdown, and determine whether the strategy is suitable for live trading. This method provides valuable insights into the best and worst-case scenarios, enabling traders to better prepare for market uncertainties and make informed decisions about strategy performance and risk management.
In our case, we will compare the original results of both strategies A and B with their potential worst-case scenarios…
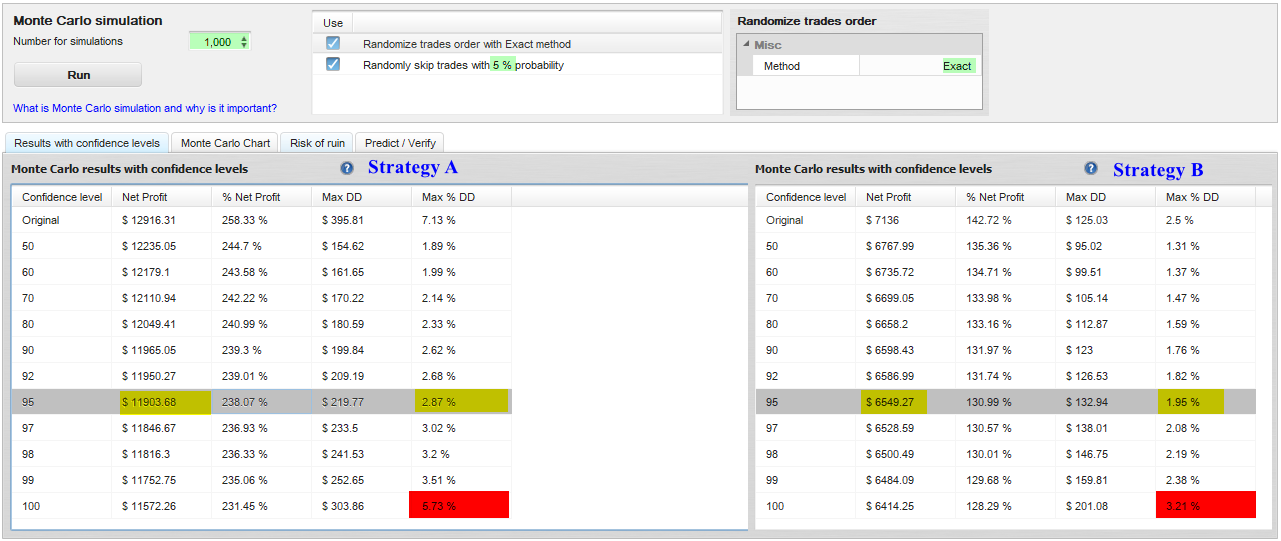
We will run a 1000 simulations using Exact randomization and 5% trades missed to determine more realistic drawdown and profit expectations.

The 95% confidence level means there is only a 5% chance that results will be worse than those simulated (96 to 100%). We will now compare the original results with those presented at this confidence level.
Strategy A
- Drawdown : The Max DD at our 95% confidence level is 2.48 times lower than the original, indicating that the strategy is expected to perform well in most scenarios.
- Net Profit : Achieving a 238.07% profit over 5 years by trading a single market is still a strong performance. The $1,000 difference compared to the original level is relatively minor and does not significantly diminish the overall success of the strategy.
Strategy B
- Drawdown : The Max DD at our 95% confidence level is 1.28 times lower than the original, indicating that the strategy is expected to perform well in most scenarios. This strategy is more conservative ( The worst-case scenario, which has a 5% probability of occurring, is experiencing a maximum drawdown of 3.21% ).
- Net Profit : Achieving a 129.68% profit over 5 years by trading a single market is still a good performance for a 5K cap.
Conclusion
The choice between Strategy A and Strategy B ultimately depends on the trader’s individual risk tolerance and investment objectives. Strategy A is ideal for those prioritizing higher profits and are willing to accept greater risk and variability. On the other hand, Strategy B offers a more conservative approach, focusing on reduced risk and consistent stability.
In our next post, we will dive deeper into the analysis, explore additional insights, and discuss potential improvements to enhance the performance of these strategies. Stay tuned!


