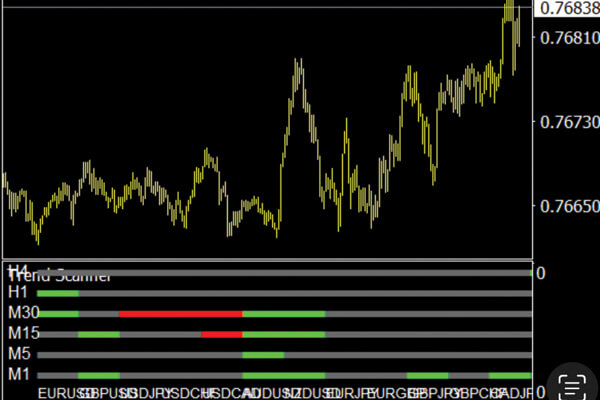
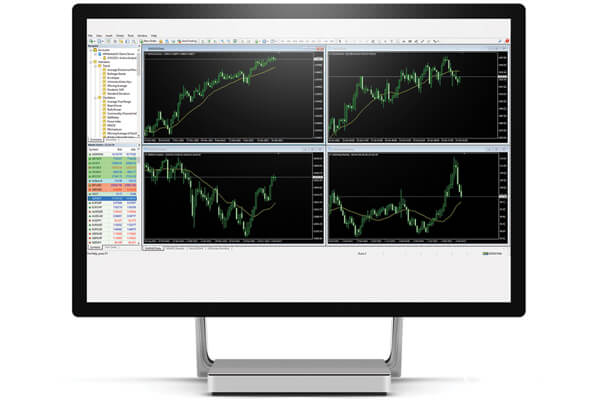
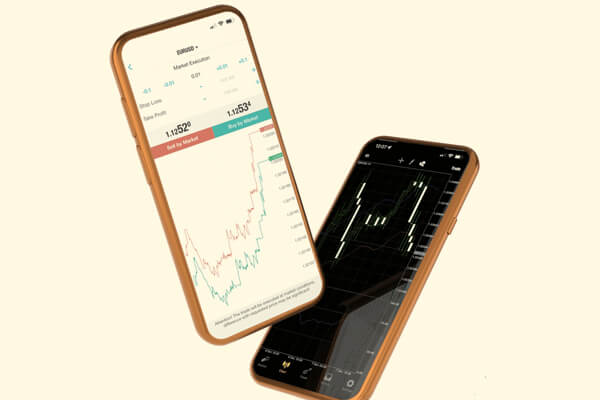
In the world of Forex trading and financial markets, analyzing trends and identifying price changes is of great importance. One of the powerful tools in this regard is the Market Trend Scanner MT4 indicator, which allows traders to quickly identify market trends. By using this indicator, users can pinpoint the strengths and weaknesses of trends and make better decisions in their trades. The Market Trend Scanner MT4 indicator comes with unique features that distinguish it from other tools. By leveraging this indicator, traders can analyze past and current trends and make accurate predictions for the future.
In the following sections, we will take a closer look at the features and advantages of the Market Trend Scanner MT4 indicator and examine its significance in the trading world.
Volume indicators assist traders and investors in visually tracking the trajectory of capital movement and the corresponding price responses to these shifts. By utilizing these tools, market participants can identify areas and levels of increased liquidity for an asset, thereby enhancing their decision-making speed when it comes to executing trades. Furthermore, these indicators facilitate a deeper understanding of market dynamics, allowing users to anticipate potential trends and reversals more effectively.

What is the best volume indicator for forex?
When it comes to forex trading, several volume indicators can prove beneficial for analyzing market trends and making informed decisions. Here are the four best volume indicators to consider:
On-Balance Volume (OBV): The On-Balance Volume indicator calculates the cumulative volume by adding the volume on up days and subtracting the volume on down days. This helps traders gauge the momentum of price movements; a rising OBV suggests that buying pressure is increasing, while a declining OBV indicates selling pressure.
2. Money Flow Index (MFI): The Money Flow Index is a momentum oscillator that measures the flow of money into and out of an asset over a specific period. The MFI takes both price and volume into account, providing insights into overbought or oversold conditions. It ranges from 0 to 100, with levels above 80 indicating overbought conditions and levels below 20 suggesting oversold conditions.
3. Volume-Weighted Average Price (VWAP): The Volume-Weighted Average Price is a trading benchmark that considers both price and volume. It provides an average price for an asset weighted by the volume traded at each price level. VWAP is particularly useful for establishing trade opportunities as it helps traders identify the true average price of an asset throughout a trading period.
4. Accumulation/Distribution Line (Accum./Dist.): The Accumulation/Distribution Line is a cumulative volume indicator that assesses how much of a security is being accumulated or distributed in relation to its price movement. It takes into account both the closing price and volume, indicating whether a stock is under accumulation (buying) or distribution (selling). A rising line usually suggests accumulation, while a falling line points to distribution.
Each of these volume indicators offers unique insights into the forex market, helping traders to better understand market dynamics and make more informed trading decisions.

It’s possible that you have searched for “forex volume scanner indicator MT4 download.” If you’re seeking further details, kindly refer to the link below.
How to Check Volume in the Forex Market
1. Use a Trading Platform: Many forex trading platforms provide volume data for various currency pairs. Look for a “Volume” indicator or section within the platform to see the trading volume for specific time frames.
2. Analyze Tick Charts: Since forex markets operate over a decentralized network and don’t have a central exchange, traders often use tick charts that show price movements based on the number of transactions or ticks rather than traditional time-based charts. This can give you insights into the volume of trades taking place.
3. Volume Indicators: Implement volume indicators, such as the On-Balance Volume (OBV) or the Money Flow Index (MFI), which can provide deeper insights into trading volume in relation to price movements. These indicators help visualize how volume correlates with price changes.

How to Calculate Volume in Forex
In the forex market, volume is traditionally measured in terms of tick volume, which refers to the number of price changes or “ticks” a currency pair experiences during a given time frame. Here’s how to calculate it:
1. Identify Ticks: A tick represents the smallest price movement of a currency pair. In forex, as prices fluctuate, every change—either up or down—counts as a tick.
2. Count Tick Movements: To determine the volume for a specific period, count the total number of ticks during that timeframe. For instance, if a currency pair moved up or down in price 200 times within one hour, the volume would be 200 ticks.
3. Monitor Timeframes: Different timeframes can yield different volume readings. For example, tick volume may vary when observed over a 5-minute chart versus a 1-hour chart, so it’s essential to use the timeframe that aligns with your trading strategy.
4. Use Software Tools: Some trading software and platforms can automatically calculate the tick volume for you, saving you the manual effort and providing real-time updates.
In summary, while the forex market does not measure volume in a traditional sense like stock markets, utilizing tick volume can provide valuable insights into market activity and liquidity, aiding traders in their decision-making processes.
In conclusion, the Forex Volume Scanner Indicator MT4 is a valuable tool for traders seeking to enhance their trading decisions. By providing insights into market dynamics and liquidity, this indicator helps traders identify trends and make more informed choices. Utilizing the Forex Volume Scanner Indicator MT4 can significantly improve a trader’s ability to navigate the complexities of the forex market and capitalize on profitable opportunities.


