A popular trading expression is “the trend is your friend.” This expression has stood the test of time because trends are critically important to any trading plan. Forex trendlines can be seen in almost any charting analysis due to its usefulness and simplicity. This article provides traders with an in-depth guide on what trendlines are, how to draw them and how to apply this when trading.
WHY IS THE TREND YOUR FRIEND IN FOREX TRADING?
Top traders will admit that there isn’t a single trading strategy that has a one hundred percent win ratio. This statement may seem obvious, but this is exactly why traders need to be on the lookout for anything that can improve their chances of making winning trades. One such candidate is the trend.
Learning how to trade in an imperfect world is very important. Trend trading is a simple way to cover up strategy imperfections by identifying the strongest trends in the market. As can be seen below, a short trade could still work out even if a trader entered as the market rose temporarily.
The dominant trend (downwards) was strong enough to possibly turn a loser into a winner depending on where the stop loss was placed.
The chart below shows that there are more pips available in the direction of the trend, as opposed to against the trend.
HOW TO DETERMINE THE TREND
To determine the trend, pull a price chart on a currency pair of your choice with between 100-200 candles. Then answer the question of which direction prices are generally moving?
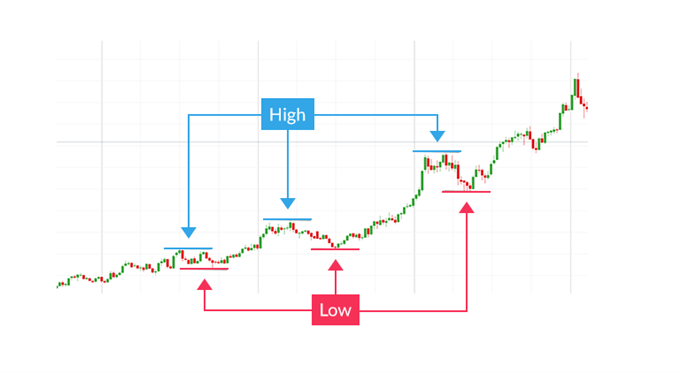
If the trend is up, then confirm the direction by looking for a series of higher highs and higher lows on the chart. A valid up trend would look similar to the below chart.

Notice how each successive high is higher than the last and each low is higher than the one that precedes it.
However, in reality, all trends will end. Therefore, this uptrend will change to a downtrend when a series of lower highs and lower lows are established. The chart below depicts the point when traders should be on the lookout for a trend reversal as the market breaks lower than the previous low.

If the trend is down, confirm the downtrend by looking for a series of lower highs and lower lows on the chart. Below is a chart of a valid downtrend.

This downtrend changes to an uptrend when a series of higher highs and higher lows begin to form. The image below depicts the trend reversal.

It is important to note that there are no specific rules for identifying high and lows to use for trend analysis. The idea is to pick the most obvious examples of an uptrend or a downtrend to trade.Insist on finding an forex pair in such an obvious trend that a ten-year-old child can identify the trend direction from across the room. If you are not sure of the trend direction, then move to the next pair where the identification is obvious.
Learn more about trendlines and other trading related topics by subscribing to our channel: https://www.mql5.com/en/channels/01be717c9c95d701 Quantum Pip, CoreX G, Indicement, The law of Jungle, Roxy, Turtle Soup Daily Opening Price, Eternis, Index Sniper Pro, Apex EA, Trend Cutter, Volume Orderflow Profile, Momentum Close


